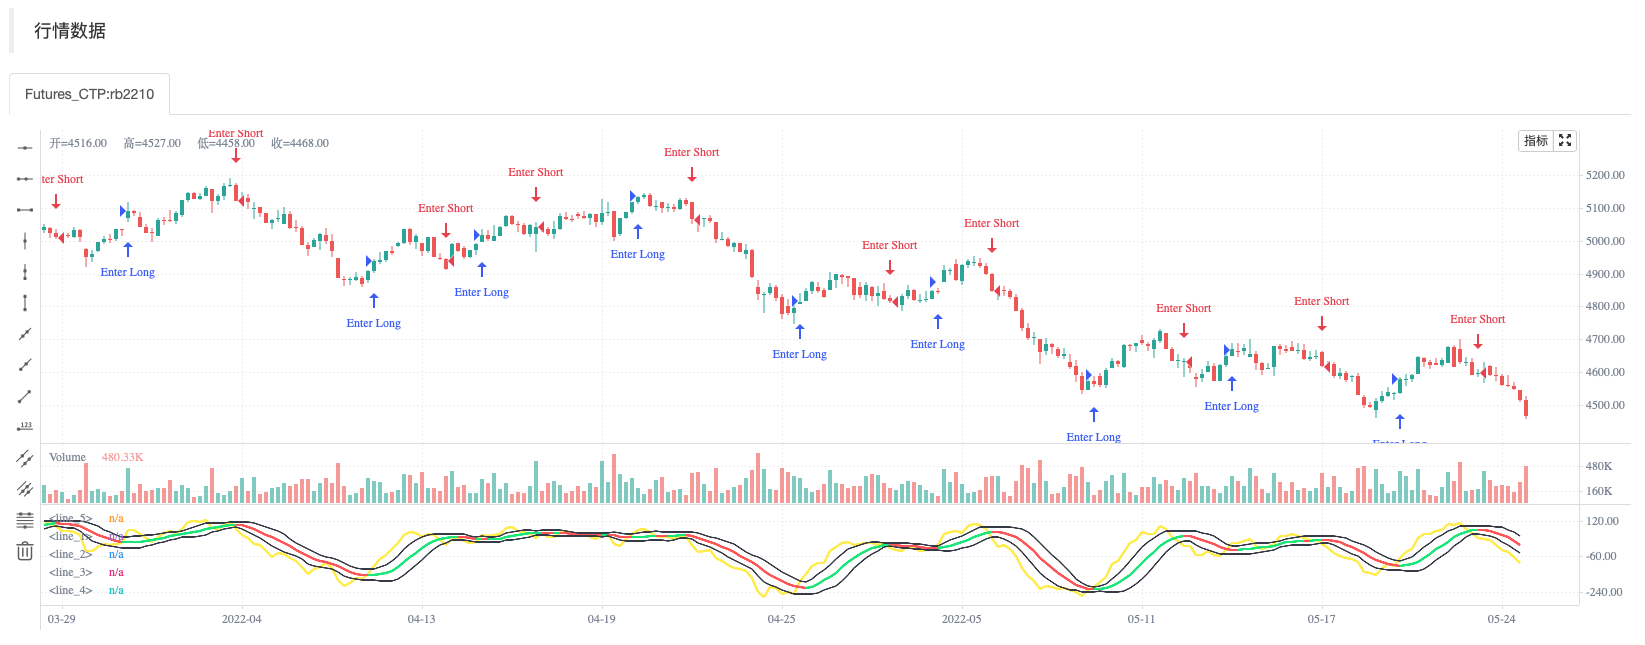
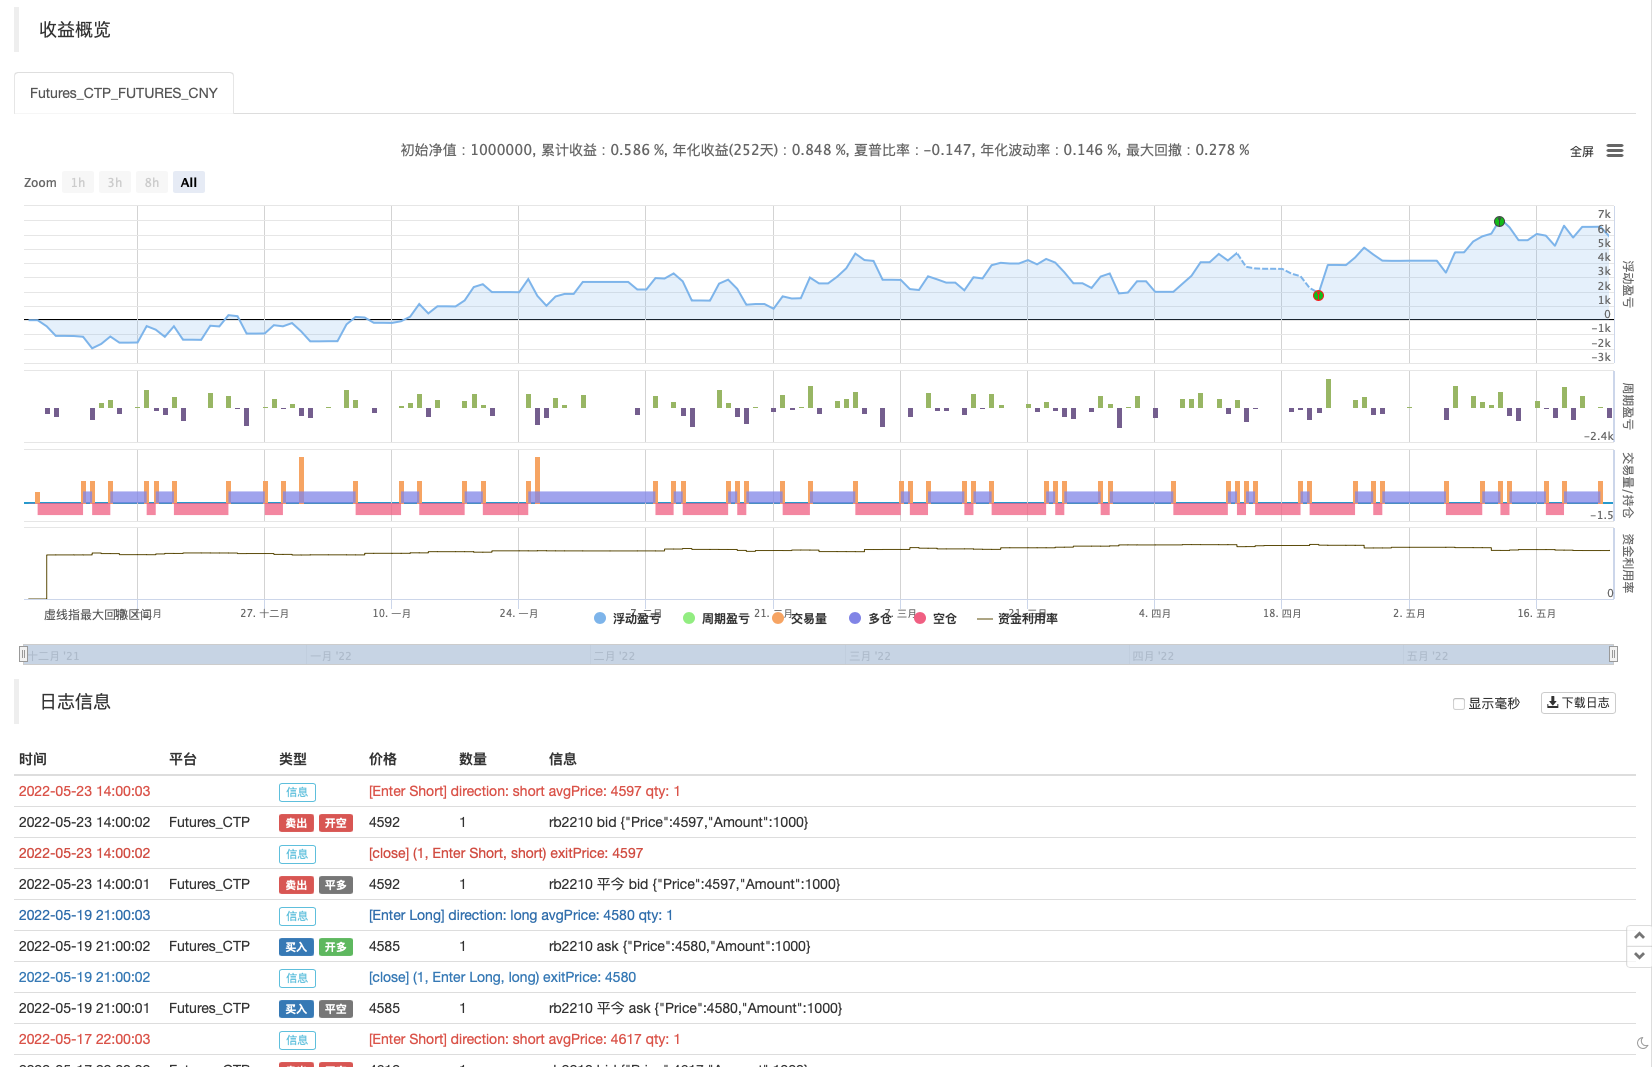
该指示器为Mobo带(动量突破带)。这些谱带是具有调整标准偏差的布林谱带。当其动量突破高于上行区间时有买入信号,当其动量突破低于下行区间时有卖出信号。 这些区间只是暗示,所有市场都有一段我们都知道是真的动荡时期。虽然价格在区间内,但据说是没有趋势的。一旦突破发生,你可以在突破方向进行交易。 我喜欢使用这些工具在每小时的时间范围内摇摆交易选项,但波段应该适用于大多数工具和时间范围。我喜欢用它在1小时图表上的SPY上进行波动,并用日线图确认趋势。
回测测试


策略源码
/*backtest
start: 2021-12-01 09:00:00
end: 2022-05-24 15:00:00
period: 1h
basePeriod: 15m
exchanges: [{"eid":"Futures_CTP","currency":"FUTURES"}]
args: [["ContractType","rb2210",360008]]
*/

//@version=4
study("Mobo Bands", overlay=false)

price           = input(hl2, "数据源")
// colorNormLength = input(3, "colorNormLength", input.integer)
dpoLength       = input(13, "dpo长度", input.integer)
// moboDisplace    = input(0, "mobo移动", input.integer)
moboLength    = input(10, "mobo长度", input.integer)

numDevDn  = input(-0.8, "下偏差系数", input.float)
numDevUp  = input(0.8, "上偏差系数", input.float)

// coloredMobo     = input(true, "coloredMobo")
// coloredFill     = input(true, "coloredFill")
// breakArrows     = input(true, "breakArrows")
// moboShowMid     = input(true, "moboShowMid")


//def DPO = price - Average(price[DPO_length / 2 + 1], DPO_length);
xsma = sma(price[int(dpoLength / 2 + 1)], dpoLength)
//alert(int(dpoLength / 2 + 1))
//xsma = sma(price, dpoLength)
DPO = price - xsma


Midline = sma(DPO, moboLength)

sDev = stdev(DPO, moboLength)

LowerBand = Midline + numDevDn * sDev
UpperBand = Midline + numDevUp * sDev

plot(DPO, color=color.yellow,linewidth=2)

plot(Midline, color=Midline > Midline[1] ? color.lime : color.red,linewidth=2)

Upper = plot(UpperBand, color=color.black,linewidth=1)
Lower = plot(LowerBand, color=color.black,linewidth=1)

plot(0, color=color.white,linewidth=1)

Signal1 = DPO > UpperBand and DPO[1] < UpperBand[1]
Signal2 = DPO < LowerBand and DPO[1] > LowerBand[1]

wasUp = 1
wasDn = 1

wasUp := Signal1 ? 1 : (Signal2 ? 0 : nz(wasUp[1]))
wasDn := Signal2 ? 1 : (Signal1 ? 0 : nz(wasDn[1]))

//plotshape(Signal1 and wasDn[1] ? UpperBand : na, style=shape.arrowup, location=location.absolute, size=size.normal, color=color.red)
//plotshape(Signal2 and wasUp[1] ? LowerBand : na, style=shape.arrowdown, location=location.absolute, size=size.normal, color=color.green)

plotshape(Signal1 and wasDn[1] ? UpperBand : na, style=shape.labelup, location=location.absolute, size=size.normal, color=color.green, text="Buy",textcolor=color.white)
plotshape(Signal2 and wasUp[1] ? LowerBand : na, style=shape.labeldown, location=location.absolute, size=size.normal, color=color.red, text="Sell",textcolor=color.white)


//fill(Upper, Lower, color=color.purple)

alertcondition(Signal1 and wasDn[1], "Break Out Arrow", "Break Out Arrow")
alertcondition(Signal2 and wasUp[1], "Break Down Arrow", "Break Down Arrow")


if Signal1 and wasDn[1]
    strategy.entry("Enter Long", strategy.long)
else if Signal2 and wasUp[1]
    strategy.entry("Enter Short", strategy.short)
相关推荐