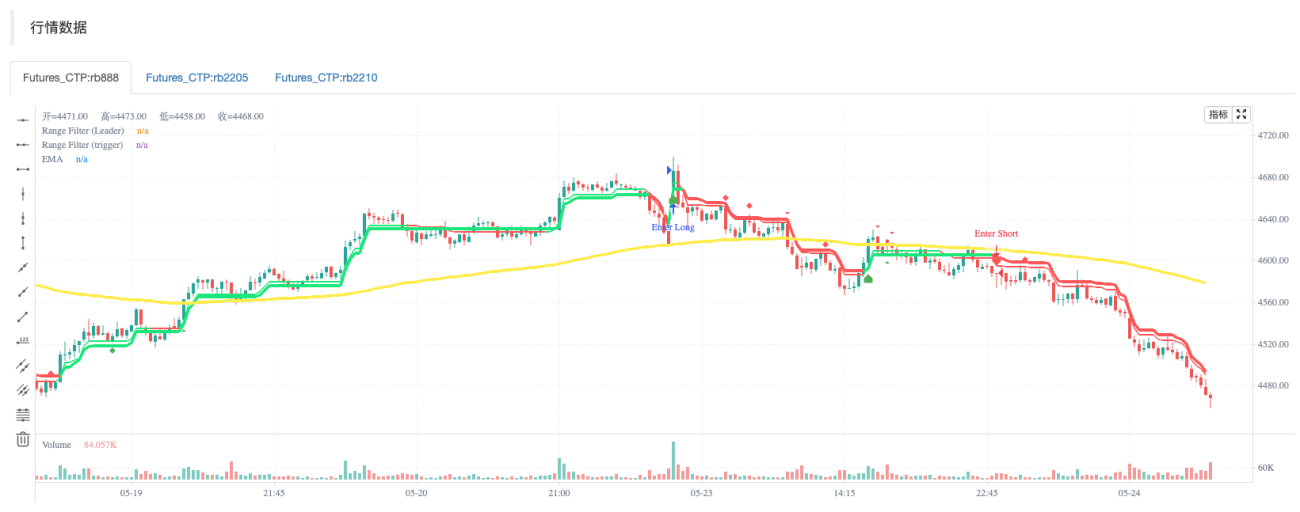
脚本结合了两个范围过滤器,一个EMA和最终振荡器。 这是一种带有警报的指示器类型的脚本,非常适合一分钟的头皮操作,最初是为NAS100开发的,但已成功用于其他符号。 这两个范围过滤器用于检测短期和中期趋势何时处于同一方向。 EMA表示长期趋势,UO用于确定资产是超买还是超卖。 这一指标与分歧指标很好地结合在一起,以增加方向变化的汇合。
此指示器的其他功能: -配置是否仅在资产未超买或超卖时显示买卖标签 -选择是仅在价格高于均线时显示买入,还是仅在均线以下显示卖出 -指示趋势穿过均线的条形图,并选择交叉或交叉下方是否应仅在反向趋势中显示。 -可以确定趋势中的回调。这可能表明趋势持续。 -可以为回调、均线交叉和买入或卖出信号创建警报
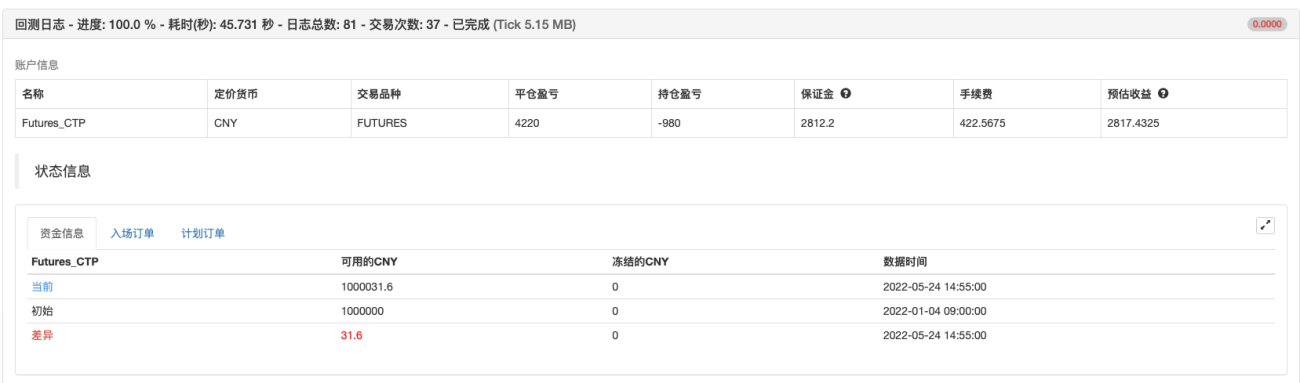
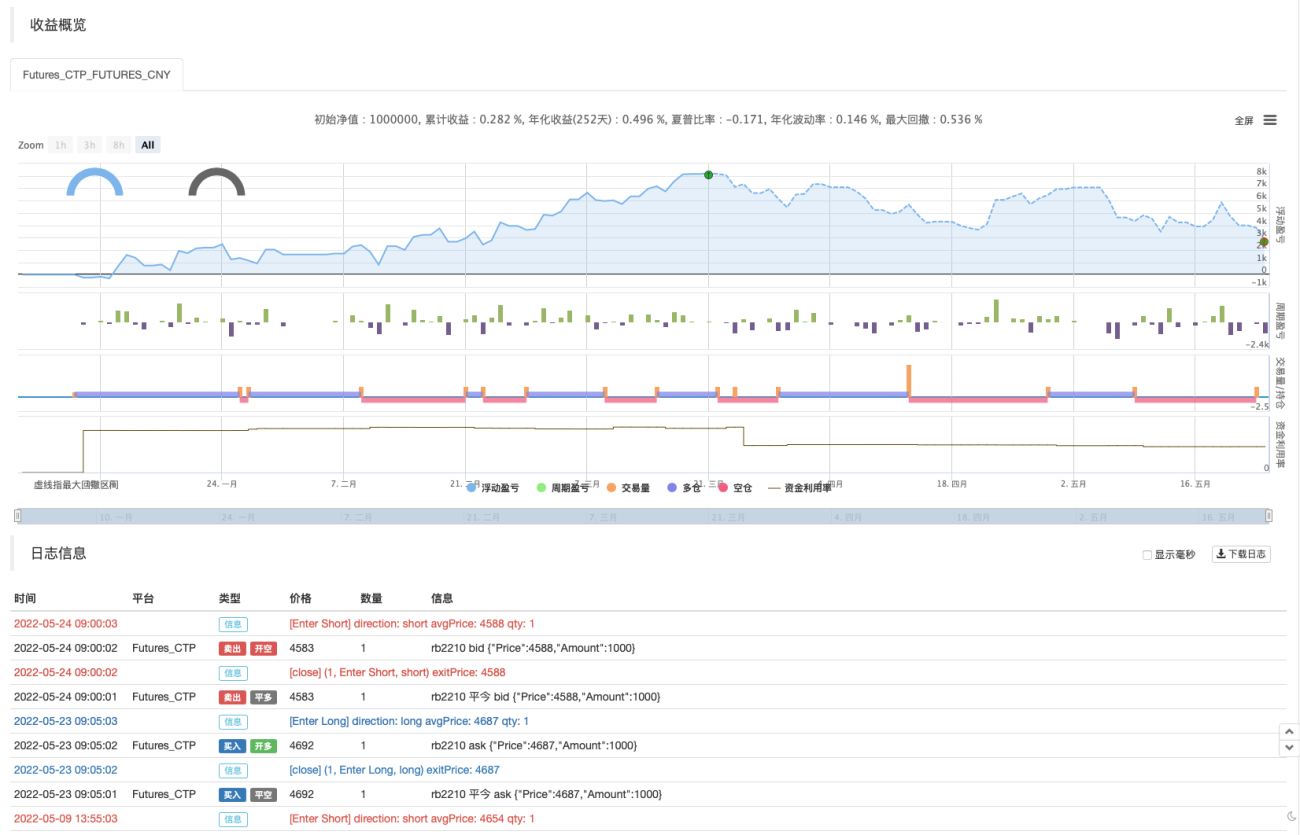
回测测试
/*backtest
start: 2022-01-01 09:00:00
end: 2022-05-24 15:00:00
period: 5m
basePeriod: 1m
exchanges: [{"eid":"Futures_CTP","currency":"FUTURES"}]
args: [["ContractType","rb888",360008]]
*/
//@version=5
// Original Script > @DonovanWall
// Previous Version > @guikroth
// Ultimate Oscillator > @PineCoders
// Updated by > @jwelmac
//////////////////////////////////////////////////////////////////////////
// Range Filter x 2, EMA and UO
//////////////////////////////////////////////////////////////////////////
indicator(title='FTL - Range Filter X2 + EMA + UO', overlay=true)
// Groups
string groupLeadingRange = "Leading Range Filter"
string groupTriggerRange = "Trigger Range Filter"
string groupEMA = "EMA"
string groupUO = "Ultimate Oscillator (UO)"
string GROUP_BUY_OPTIONS = "Buy Options"
string GROUP_SELL_OPTIONS = "Sell Options"
//------- ********* -------- ********* ---------
// Range Filter (Leader) {
// Source
src = input(defval=hl2, title='数据源', group=groupLeadingRange)
// Sampling Period
per = input.int(defval=30, minval=1, title='采样周期', group=groupLeadingRange)
// Range Multiplier
mult = input.float(defval=2.6, minval=0.1, title='区间乘数', group=groupLeadingRange)
// Smooth Average Range {
smoothrng(x, t, m) =>
wper = t * 2 - 1
avrng = ta.ema(math.abs(x - x[1]), t)
_smoothrng = ta.ema(avrng, wper) * m
_smoothrng
// }
smrng = smoothrng(src, per, mult)
// Range Filter{
rngfilter(x, r) =>
rngfilt = x
rngfilt := x > nz(rngfilt[1]) ? x - r < nz(rngfilt[1]) ? nz(rngfilt[1]) : x - r : x + r > nz(rngfilt[1]) ? nz(rngfilt[1]) : x + r
rngfilt
//}
filt = rngfilter(src, smrng)
// Filter Direction
upward = 0.0
upward := filt > filt[1] ? nz(upward[1]) + 1 : filt < filt[1] ? 0 : nz(upward[1])
downward = 0.0
downward := filt < filt[1] ? nz(downward[1]) + 1 : filt > filt[1] ? 0 : nz(downward[1])
// Colors
filtcolor = upward > 0 ? color.lime : downward > 0 ? color.red : color.orange
filtplot = plot(filt, color=filtcolor, linewidth=1, title='Range Filter (Leader)')
// }
//------- ********* -------- ********* ---------
//------- ********* -------- ********* ---------
// Range Filter (Trigger){
// Source
src2 = input(defval=ohlc4, title='数据源', group=groupTriggerRange)
// Sampling Period
// Settings for 1min chart, US 100.
per2 = input.int(defval=48, minval=1, title='采样周期', group=groupTriggerRange)
// Range Multiplier
mult2 = input.float(defval=3.4, minval=0.1, title='区间乘数', group=groupTriggerRange)
// Smooth Average Range
smrng2 = smoothrng(src2, per2, mult2)
// Range Filter
rngfilt2(x, r) =>
rngfilt = x
rngfilt := x > nz(rngfilt[1]) ? x - r < nz(rngfilt[1]) ? nz(rngfilt[1]) : x - r : x + r > nz(rngfilt[1]) ? nz(rngfilt[1]) : x + r
rngfilt
filt2 = rngfilt2(src2, smrng2)
// Filter Direction
upward2 = 0.0
upward2 := filt2 > filt2[1] ? nz(upward2[1]) + 1 : filt2 < filt2[1] ? 0 : nz(upward2[1])
downward2 = 0.0
downward2 := filt2 < filt2[1] ? nz(downward2[1]) + 1 : filt2 > filt2[1] ? 0 : nz(downward2[1])
// Colors
filtcolor2 = upward2 > 0 ? color.lime : downward2 > 0 ? color.red : color.orange
filtplot2 = plot(filt2, color=filtcolor2, linewidth=3, title='Range Filter (trigger)')
barcolor = src2 > filt2 and upward2 > 0
? color.green
: src2 < filt2 and downward > 0
? color.red
: color.rgb(120, 123, 134)
// Bar Color
//barcolor(barcolor)
// }
//------- ********* -------- ********* ---------
//------- ********* -------- ********* ---------
// Default EMA 144 {
len4 = input.int(144, minval=1, title='周期', group=groupEMA)
src4 = input(close, title='数据源')
ema = ta.ema(src4, len4)
plot(ema, linewidth=3, color=color.new(color.yellow, 0), title='EMA')
closeAboveEma = close > ema
closeBelowEma = close < ema
uptrendCrossoverOnly = input.bool(false, title="仅在上升趋势中显示交叉", group=groupEMA)
downtrendCrossunderOnly = input.bool(false, title="仅在下降趋势中显示交叉", group=groupEMA)
// END EMA
// }
//------- ********* -------- ********* ---------
// ------ UO {
average(bp, tr_, length) => math.sum(bp, length) / math.sum(tr_, length)
uo() =>
length1 = input.int(7, minval=1, title = "快线周期", group=groupUO),
length2 = input.int(14, minval=1, title = "中线周期", group=groupUO),
length3 = input.int(28, minval=1, title = "慢线周期", group=groupUO)
high_ = math.max(high, close[1])
low_ = math.min(low, close[1])
bp = close - low_
tr_ = high_ - low_
avg7 = average(bp, tr_, length1)
avg14 = average(bp, tr_, length2)
avg28 = average(bp, tr_, length3)
100 * (4*avg7 + 2*avg14 + avg28)/7
uoLevel = uo()
// }
// Break Outs
// Conditions {
longCond = bool(na)
shortCond = bool(na)
longCond := src > filt2 and src > src[1] and upward2 > 0 or src > filt2 and src < src[1] and upward2 > 0
shortCond := src < filt2 and src < src[1] and downward2 > 0 or src < filt2 and src > src[1] and downward2 > 0
CondIni = 0
CondIni := longCond ? 1 : shortCond ? -1 : CondIni[1]
// Long (Buy){
overBoughtLevel = input.float(defval=60, minval=50, title='UO超买值', group=GROUP_BUY_OPTIONS)
longWhenNotOverbought = input.bool(true, title = '仅在未超买时显示买入(UO)', tooltip = 'Show BUY Signal only when not overbought according to UO', group=GROUP_BUY_OPTIONS)
longOnlyAboveEma = input.bool(true, title = '仅在均线上方显示买入', tooltip = 'Show BUY Signal only when price closes above the EMA', group=GROUP_BUY_OPTIONS)
longCondition = longCond and CondIni[1] == -1
overBought = uoLevel > overBoughtLevel
if (longCondition and longWhenNotOverbought)
longCondition := not overBought
if (longCondition and longOnlyAboveEma)
longCondition := closeAboveEma
//}
// Short (Sell){
overSoldLevel = input.float(defval=40, maxval=50, title='UO超卖值', group=GROUP_SELL_OPTIONS)
shortWhenNotOversold = input.bool(true, title = '仅在未超卖时显示卖出(UO)', tooltip = 'Show SELL Signal only when not oversold according to UO', group=GROUP_SELL_OPTIONS)
shortOnlyBelowEma = input.bool(true, title = '仅在均线以下显示卖出', tooltip = 'Show SELL Signal only when price closes below the EMA', group=GROUP_SELL_OPTIONS)
shortCondition = shortCond and CondIni[1] == 1
overSold = uoLevel < overSoldLevel
if (shortCondition and shortWhenNotOversold)
shortCondition := not overSold
if (shortCondition and shortOnlyBelowEma)
shortCondition := closeBelowEma
//}
// }
// Trend directions {
trendUp = upward and upward2
trendDown = downward and downward2
// }
// MA Crossover{
arrowSize = size.small
emaCrossover = 'EMA Crossover'
didEmaCrossover = (not uptrendCrossoverOnly or trendUp) and ta.crossover(close, ema)
plotshape(
didEmaCrossover,
title = emaCrossover,
style = shape.triangleup,
size = arrowSize,
location = location.belowbar,
color = color.new(color.green, 0)
)
emaCrossunder = 'EMA Crossunder'
didEmaCrossunder = (not downtrendCrossunderOnly or trendDown) and ta.crossunder(close, ema)
plotshape(
didEmaCrossunder,
title = emaCrossunder,
style = shape.triangledown,
size = arrowSize,
location = location.abovebar,
color = color.new(color.red, 0)
)
// }
// Pullbacks (a possible indicator of trend continuation) {
// Conditions:
// - Both filters going in same direction
sameDirection = trendUp or trendDown
// Did the previous candle close in the opposite direction
prevOpp = (trendUp and close[1] < open[1]) or (trendDown and open[1] < close[1])
// Is the current candle in the trend direction
inTrendDirection = (trendDown and close < open) or (trendUp and close > open)
// - previous candle: crossover one or both in downtrend, crossunder one or both in uptrend
prevLimit = trendDown ? high[1] : low[1]
var previousCross = false
if (trendDown)
previousCross := ta.crossover(prevLimit, filt[1]) or ta.crossover(prevLimit, filt2[1])
else
previousCross := ta.crossunder(prevLimit, filt[1]) or ta.crossunder(prevLimit, filt2[1])
// - current candle: crossunder one or both in downtrend, crossover one or both in uptrend
currentReturn = trendDown
? close < filt
: close > filt
pullback = prevOpp and inTrendDirection and sameDirection and previousCross and currentReturn
uptrendPullback = 'Uptrend Pullback'
isUptrendPullback = pullback and trendUp
plotshape(
isUptrendPullback,
title = uptrendPullback,
style = shape.diamond,
size = arrowSize,
location = location.belowbar,
color = color.new(color.green, 0)
)
downtrendPullback = 'Downtrend Pullback'
isDowntrendPullback = pullback and trendDown
plotshape(
isDowntrendPullback,
title = 'Downtrend Pullback',
style = shape.diamond,
size = arrowSize,
location = location.abovebar,
color = color.new(color.red, 0)
)
// }
// Buy/Sell Signal {
plotshape(longCondition, title='Buy Signal', text='BUY', textcolor=color.new(color.white, 0), style=shape.labelup, size=size.normal, location=location.belowbar, color=color.new(color.green, 0))
plotshape(shortCondition, title='Sell Signal', text='SELL', textcolor=color.new(color.white, 0), style=shape.labeldown, size=size.normal, location=location.abovebar, color=color.new(color.red, 0))
//}
//Alerts{
alertcondition(longCondition, title='Buy Alert', message='BUY')
alertcondition(shortCondition, title='Sell Alert', message='SELL')
alertcondition(didEmaCrossover, title = emaCrossover, message = emaCrossover)
alertcondition(didEmaCrossunder, title = emaCrossunder, message = emaCrossover)
alertcondition(isUptrendPullback, title=uptrendPullback, message = uptrendPullback)
alertcondition(isDowntrendPullback, title=downtrendPullback, message = downtrendPullback)
// }
// For use like Strategy, {
//1. Change the word "indicator" for "strategy" at the top
//2. Remove the "//" below
//strategy.entry( id = "Long", long = true, when = longCondition )
//strategy.close( id = "Long", when = shortCondition )
// }
if longCondition
strategy.entry("Enter Long", strategy.long)
else if shortCondition
strategy.entry("Enter Short", strategy.short)