

开始的想法
最近在看一些经典的技术分析书籍,道氏理论作为技术分析的鼻祖,总是被反复提及。但是说实话,每次看到那些手工画线的图表,我都觉得太主观了。作为一个习惯了用代码解决问题的人,我想试试能不能把道氏理论的核心思想用程序实现出来。
优宽量化包含完整的商品期货量化策略调试环境和完整的数据,就拿来练手。这篇文章记录了我的整个探索过程,包括踩过的坑和一些想法。
为什么选择道氏理论?
在开始编程之前,我想先说说为什么要选择道氏理论作为量化实现的目标。
理论基础的重要性
道氏理论不仅仅是一个交易策略,它是现代技术分析的基石。查尔斯·道(Charles Dow)在19世纪末提出这个理论时,为整个技术分析领域奠定了基础。几乎所有后来的技术分析方法,无论是移动平均线、RSI、MACD,还是各种形态分析,都能从道氏理论中找到影子。
这就像学武功一样,如果你连基本功都没有扎实,再花哨的招式也是花架子。在量化交易中也是如此,如果你对最基础的理论都没有深入理解,那些复杂的机器学习算法和神经网络,很可能就是在拟合历史数据的噪音。
道氏理论的核心价值
道氏理论最大的价值在于它的简洁性和普适性。它不依赖复杂的数学公式,不需要大量的指标组合,就能抓住市场的本质规律。这种简洁性让它在过去一百多年里依然适用,无论是股票、商品期货,还是现在的数字货币市场。
更重要的是,道氏理论强调的是对市场结构的理解,而不是对价格的预测。这种思维方式对于量化交易来说特别有价值,因为它教会我们关注概率,而不是确定性。
道氏理论到底说了什么
道氏理论其实很简单,就是说市场有三种趋势:
- 主要趋势:大方向,可能持续几个月到几年
- 次要趋势:对主要趋势的调整,一般几周到几个月
- 短期趋势:日常波动,几天到几周
核心思想就是:确定主要趋势后,在次要趋势的回调中找机会入场。
听起来很简单,但用代码实现就发现问题了。什么叫"主要趋势"?什么叫"回调"?这些都需要量化定义。
道氏理论的六个基本原则
在开始编程之前,我重新梳理了道氏理论的六个基本原则:
- 市场价格反映一切:这个原则告诉我们,价格已经包含了所有已知信息
- 市场有三种趋势:主要趋势、次要趋势、短期趋势
- 主要趋势分三个阶段:累积阶段、参与阶段、分配阶段
- 两个指数必须相互确认:原本是指工业指数和铁路指数,现在可以理解为不同市场的相互印证
- 成交量必须确认趋势:趋势的确立需要成交量的配合
- 趋势持续直到明确的反转信号出现:这是最重要的原则,告诉我们要顺势而为
探索过程:从理论到代码的漫长旅程
第一次尝试:简单的移动平均线
最开始,我天真地认为道氏理论就是简单的趋势跟踪,于是写了一个基于双移动平均线的策略:
pine
ma_short = ta.sma(close, 20)
ma_long = ta.sma(close, 50)
trend = ma_short > ma_long ? 1 : -1
结果可想而知,这个策略在震荡市中被打得体无完肤。我很快意识到,道氏理论绝不是简单的移动平均线穿越。
第二次尝试:寻找波峰波谷
既然道氏理论强调高点和低点的关系,我开始尝试识别波峰波谷。最初我用了一个非常简单的方法:
            pine

            // 错误的方法
is_peak = high > high[1] and high > high[-1]
is_valley = low < low[1] and low < low[-1]
这个方法的问题很快就暴露了:每个小的价格波动都会被识别为波峰波谷,产生大量噪音。我意识到需要更强的过滤条件。
第三次尝试:引入时间窗口
我开始使用固定的时间窗口来寻找局部极值:
            pine

            lookback = 5
is_peak = high == ta.highest(high, lookback * 2 + 1)
is_valley = low == ta.lowest(low, lookback * 2 + 1)
这个方法好了一些,但还是有问题。固定的时间窗口无法适应市场的变化,在快速波动的时候会错过重要的转折点,在缓慢波动的时候又会产生太多信号。
第四次尝试:动态时间窗口
我尝试根据市场的波动性来动态调整时间窗口:
            pine

            volatility = ta.atr(14)
dynamic_lookback = int(volatility / ta.sma(volatility, 50) * 10)
这个想法不错,但实现起来很复杂,而且效果也不稳定。我开始怀疑是不是方向错了。
第五次尝试:回到经典
经过几次失败后,我决定回到Pine Script的经典函数:ta.pivothigh() 和 ta.pivotlow()。这两个函数实际上就是在寻找局部极值,但它们的实现更加稳定。
            pine

            pivotLookback = 10
pivotHighPrice = ta.pivothigh(high, pivotLookback, pivotLookback)
pivotLowPrice = ta.pivotlow(low, pivotLookback, pivotLookback)
这个lookback参数很关键。设置得太小,会找到很多无意义的小波动;设置得太大,又会错过重要的转折点。我试了很多数值,发现10-15之间比较合适。
参数调优的痛苦过程
为了找到最优的lookback参数,我做了大量的回测。在不同的品种上,最优参数差别很大:
- 螺纹钢:lookback = 8-12
- 铜:lookback = 10-15
- 豆粕:lookback = 12-18
- 原油:lookback = 6-10
我发现,活跃品种需要更短的lookback,不活跃的品种需要更长的lookback。但这又带来了一个新问题:如何让策略自适应不同的品种?
第二步:判断趋势方向
有了关键点,下一步就是判断趋势。我写了个简单的逻辑:
            pine

            var float lastPivotHigh = na, var float prevPivotHigh = na
var float lastPivotLow = na, var float prevPivotLow = na

if not na(pivotHighPrice)
    prevPivotHigh := lastPivotHigh
    lastPivotHigh := pivotHighPrice
if not na(pivotLowPrice)
    prevPivotLow := lastPivotLow
    lastPivotLow := pivotLowPrice
然后判断趋势:
            pine

            var int trendDirection = 0
var int prevTrendDirection = 0
if not na(lastPivotHigh) and not na(prevPivotHigh) and not na(lastPivotLow) and not na(prevPivotLow)
    isUptrend = lastPivotHigh > prevPivotHigh and lastPivotLow > prevPivotLow
    isDowntrend = lastPivotHigh < prevPivotHigh and lastPivotLow < prevPivotLow
    if isUptrend and trendDirection != 1
        prevTrendDirection := trendDirection
        trendDirection := 1
    else if isDowntrend and trendDirection != -1
        prevTrendDirection := trendDirection
        trendDirection := -1
这里有个问题,就是需要至少两个高点和两个低点才能判断趋势,所以策略开始时会有一段空白期。但是加入了对趋势变化的记录,这样可以检测到趋势的反转信号。
第三步:寻找入场点
有了趋势方向,接下来就是找入场点。道氏理论的思路是在主要趋势确立后,等待次要趋势的回调。
我用了一个简单的EMA来识别回调:
            pine

            pullbackEmaLength = 21
pullbackEma = ta.ema(close, pullbackEmaLength)

bool buyPullback = isUptrendConfirmed and ta.crossunder(low, pullbackEma)
bool sellRally = isDowntrendConfirmed and ta.crossover(high, pullbackEma)
这个想法是:在上升趋势中,如果价格回调到EMA附近,就是买入机会。下降趋势中反之。
加入ADX过滤
为了过滤震荡市的假信号,我加入了ADX指标:
            pine

            [diPlus, diMinus, adx] = ta.dmi(14, 14)
bool adxTrendOk = adx > adxThreshold

bool goLong = buyPullback and adxTrendOk
bool goShort = sellRally and adxTrendOk
只有当ADX大于阈值时才考虑入场,这样可以确保市场处于趋势状态。
风险管理:最重要的改进
这次改进的重点就是风险管理。原来的策略在平仓方面确实有些问题,这次做了几个重要改进:
1. 更及时的止损
原来用low <= stopLossPrice和high >= stopLossPrice来判断止损,但这样可能在价格快速变动时错过平仓机会。现在改用收盘价:
            pine

            // 多头止损
if close <= stopLossPrice
    strategy.close("多头", comment="止损")

// 空头止损
if close >= stopLossPrice
    strategy.close("空头", comment="止损")
2. 趋势反转平仓
这是一个重要的新功能。当趋势发生反转时,即使没有触及止损或止盈,也要主动平仓:
            pine

            // 趋势反转信号
bool trendReversalToDown = enableTrendReversal and prevTrendDirection == 1 and trendDirection == -1
bool trendReversalToUp = enableTrendReversal and prevTrendDirection == -1 and trendDirection == 1

// 趋势反转平仓
if strategy.position_size > 0 and trendReversalToDown
    strategy.close("多头", comment="趋势反转")
if strategy.position_size < 0 and trendReversalToUp
    strategy.close("空头", comment="趋势反转")
3. 移动止损
当第一个止盈目标达到后,将止损移动到盈亏平衡点,锁定利润:
            pine

            // 止盈1触发后移动止损
else if not tp1_hit and close >= takeProfitPrice1
    strategy.close("多头", comment="止盈1", qty_percent=qtyPercentTP1)
    tp1_hit := true
    stopLossPrice := entryPrice  // 移动止损到入场价
4. 分级止盈
保持原来的分级止盈逻辑,但改进了执行顺序:
            pine

            if strategy.position_size > 0
    if close <= stopLossPrice
        strategy.close("多头", comment="止损")
        tp1_hit := false
    else if trendReversalToDown
        strategy.close("多头", comment="趋势反转")
        tp1_hit := false
    else if not tp1_hit and close >= takeProfitPrice1
        strategy.close("多头", comment="止盈1", qty_percent=qtyPercentTP1)
        tp1_hit := true
        stopLossPrice := entryPrice
    else if tp1_hit and close >= takeProfitPrice2
        strategy.close("多头", comment="止盈2")
        tp1_hit := false
可视化改进
为了更好地观察策略的执行情况,加入了止损止盈线的显示:
            pine

            // 显示止损止盈线
plot(strategy.position_size != 0 ? stopLossPrice : na, "止损线", color=color.red, linewidth=2)
plot(strategy.position_size != 0 ? takeProfitPrice1 : na, "止盈1", color=color.green, linewidth=1)
plot(strategy.position_size != 0 ? takeProfitPrice2 : na, "止盈2", color=color.green, linewidth=2)
这样在图表上可以清楚地看到当前持仓的风险控制线,有助于理解策略的执行逻辑。
完整的改进版代码
把所有的改进整合起来,就是这个增强版策略:
            pine

            /*backtest
start: 2024-07-18 09:00:00
end: 2025-07-17 15:00:00
period: 1h
basePeriod: 1h
exchanges: [{"eid":"Futures_CTP","currency":"FUTURES","balance":10000000}]
args: [["ContractType","cu888",360008]]
*/

//@version=5
strategy("道氏理论期货策略-改进版",
         shorttitle="Dow Theory Enhanced",
         overlay=true)

// 参数设置
pivotLookback = input.int(10, "关键点回看周期")
pullbackEmaLength = input.int(21, "回调EMA周期")
riskRewardRatio1 = input.float(1.5, "止盈1倍数")
riskRewardRatio2 = input.float(3.0, "止盈2倍数")
qtyPercentTP1 = input.int(50, "止盈1仓位比例")
adxThreshold = input.float(25, "ADX阈值")
enableTrendReversal = input.bool(true, "启用趋势反转平仓")

// 技术指标
pivotHighPrice = ta.pivothigh(high, pivotLookback, pivotLookback)
pivotLowPrice = ta.pivotlow(low, pivotLookback, pivotLookback)
pullbackEma = ta.ema(close, pullbackEmaLength)
[diPlus, diMinus, adx] = ta.dmi(14, 14)

// 趋势识别
var float lastPivotHigh = na, var float prevPivotHigh = na
var float lastPivotLow = na, var float prevPivotLow = na

if not na(pivotHighPrice)
    prevPivotHigh := lastPivotHigh
    lastPivotHigh := pivotHighPrice
if not na(pivotLowPrice)
    prevPivotLow := lastPivotLow
    lastPivotLow := pivotLowPrice

var int trendDirection = 0
var int prevTrendDirection = 0
if not na(lastPivotHigh) and not na(prevPivotHigh) and not na(lastPivotLow) and not na(prevPivotLow)
    isUptrend = lastPivotHigh > prevPivotHigh and lastPivotLow > prevPivotLow
    isDowntrend = lastPivotHigh < prevPivotHigh and lastPivotLow < prevPivotLow
    if isUptrend and trendDirection != 1
        prevTrendDirection := trendDirection
        trendDirection := 1
    else if isDowntrend and trendDirection != -1
        prevTrendDirection := trendDirection
        trendDirection := -1

// 入场条件
bool isUptrendConfirmed = trendDirection == 1
bool isDowntrendConfirmed = trendDirection == -1
bool buyPullback = isUptrendConfirmed and ta.crossunder(low, pullbackEma)
bool sellRally = isDowntrendConfirmed and ta.crossover(high, pullbackEma)
bool adxTrendOk = adx > adxThreshold
bool goLong = buyPullback and adxTrendOk
bool goShort = sellRally and adxTrendOk

// 趋势反转信号
bool trendReversalToDown = enableTrendReversal and prevTrendDirection == 1 and trendDirection == -1
bool trendReversalToUp = enableTrendReversal and prevTrendDirection == -1 and trendDirection == 1

// 风险管理
var float stopLossPrice = na
var float takeProfitPrice1 = na
var float takeProfitPrice2 = na
var bool tp1_hit = false
var float entryPrice = na

// 开仓
if strategy.position_size == 0
    tp1_hit := false

    if goLong
        stopLossPrice := lastPivotLow
        entryPrice := close
        riskSize = close - stopLossPrice
        if riskSize > 0
            takeProfitPrice1 := close + (riskSize * riskRewardRatio1)
            takeProfitPrice2 := close + (riskSize * riskRewardRatio2)
            strategy.entry("多头", strategy.long)

    if goShort
        stopLossPrice := lastPivotHigh
        entryPrice := close
        riskSize = stopLossPrice - close
        if riskSize > 0
            takeProfitPrice1 := close - (riskSize * riskRewardRatio1)
            takeProfitPrice2 := close - (riskSize * riskRewardRatio2)
            strategy.entry("空头", strategy.short)

// 改进的平仓逻辑
if strategy.position_size > 0  // 多头持仓
    // 止损 - 使用close价格而不是low,更及时
    if close <= stopLossPrice
        strategy.close("多头", comment="止损")
        tp1_hit := false
    // 趋势反转平仓
    else if trendReversalToDown
        strategy.close("多头", comment="趋势反转")
        tp1_hit := false
    // 止盈1
    else if not tp1_hit and close >= takeProfitPrice1
        strategy.close("多头", comment="止盈1", qty_percent=qtyPercentTP1)
        tp1_hit := true
        // 移动止损到盈亏平衡点
        stopLossPrice := entryPrice
    // 止盈2
    else if tp1_hit and close >= takeProfitPrice2
        strategy.close("多头", comment="止盈2")
        tp1_hit := false

if strategy.position_size < 0  // 空头持仓
    // 止损 - 使用close价格而不是high,更及时
    if close >= stopLossPrice
        strategy.close("空头", comment="止损")
        tp1_hit := false
    // 趋势反转平仓
    else if trendReversalToUp
        strategy.close("空头", comment="趋势反转")
        tp1_hit := false
    // 止盈1
    else if not tp1_hit and close <= takeProfitPrice1
        strategy.close("空头", comment="止盈1", qty_percent=qtyPercentTP1)
        tp1_hit := true
        // 移动止损到盈亏平衡点
        stopLossPrice := entryPrice
    // 止盈2
    else if tp1_hit and close <= takeProfitPrice2
        strategy.close("空头", comment="止盈2")
        tp1_hit := false

// 画图
plot(pullbackEma, "回调EMA", color=color.orange)
plotshape(pivotHighPrice, style=shape.xcross, location=location.absolute, color=color.red, size=size.tiny)
plotshape(pivotLowPrice, style=shape.xcross, location=location.absolute, color=color.blue, size=size.tiny)

// 显示止损止盈线
plot(strategy.position_size != 0 ? stopLossPrice : na, "止损线", color=color.red, linewidth=2)
plot(strategy.position_size != 0 ? takeProfitPrice1 : na, "止盈1", color=color.green, linewidth=1)
plot(strategy.position_size != 0 ? takeProfitPrice2 : na, "止盈2", color=color.green, linewidth=2)
不同品种的表现差异
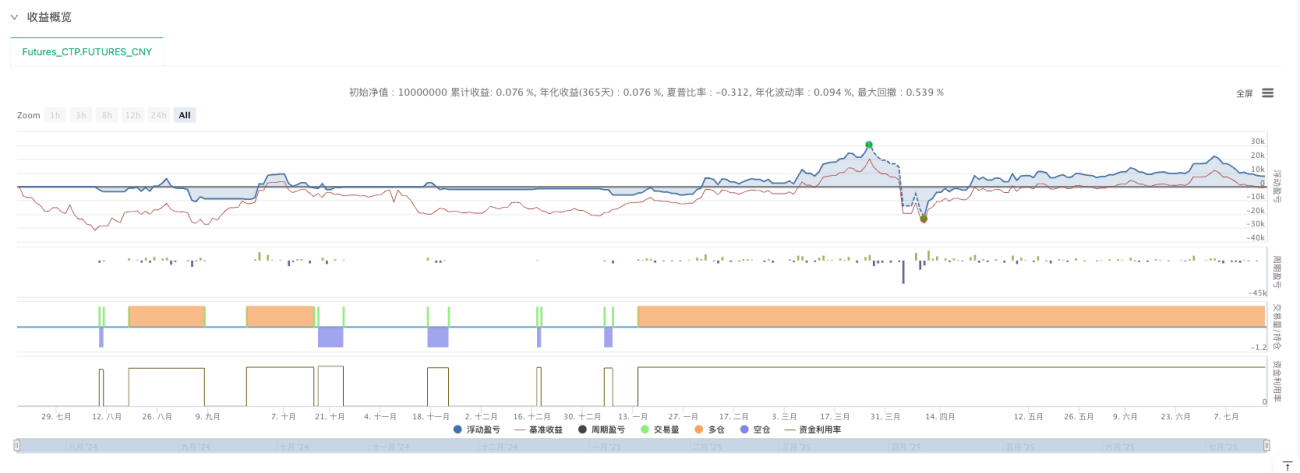
- 铜期货:与全球宏观趋势相关性较高,整体回测呈现较大的波动
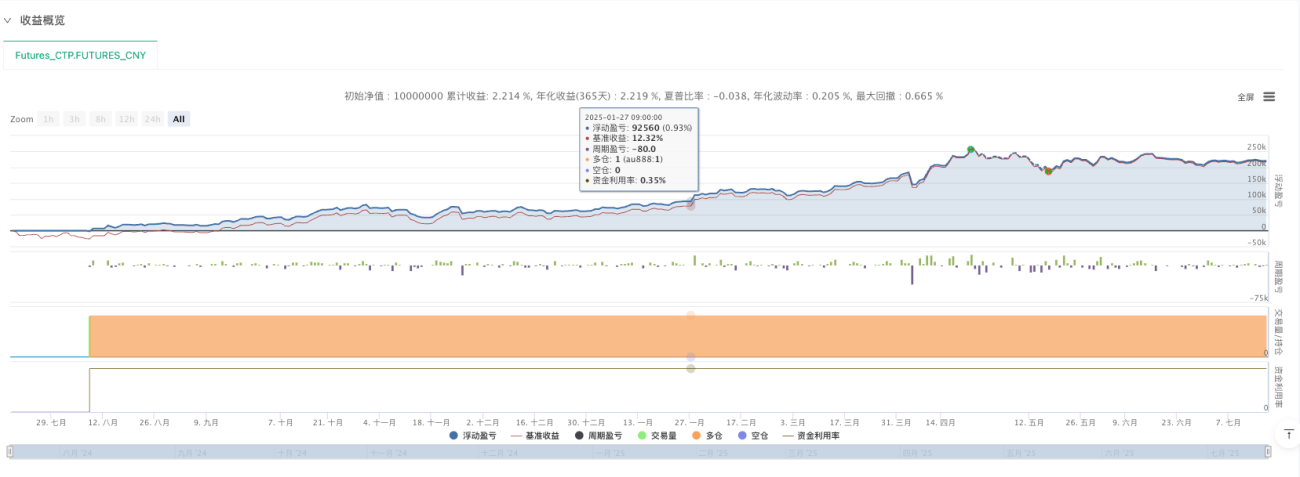
-
黄金期货:趋势性较强,自20240807持有多仓一直至今,显示出完整的趋势捕捉能力。
-
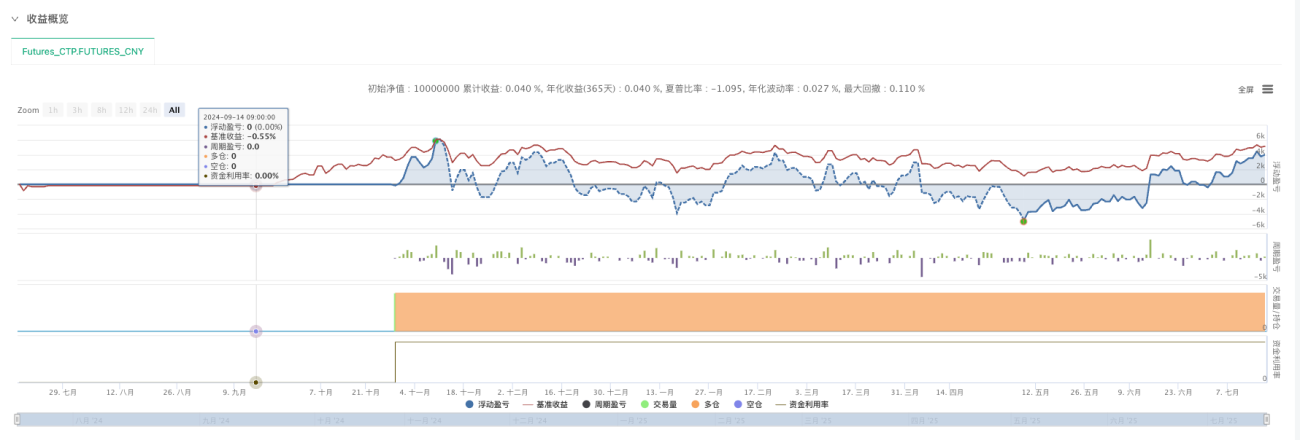
农产品期货:季节性特征明显,需要调整时间周期参数以适应不同的波动特征
参数调优的经验
-
趋势反转开关:在强趋势市场中可以关闭趋势反转平仓,在震荡市中建议开启
-
ADX阈值:活跃品种可以设置得低一些(20-25),不活跃品种设置得高一些(25-30)
-
止盈比例:可以根据品种的波动特征调整,高波动品种可以设置更大的止盈倍数
-
时间周期:根据品种特征,长趋势品种可以设置较大周期,波段品种选择较短周期
策略局限性与风险提示
虽然这个改进版本在某些品种的回测中表现不错,但必须诚实地指出策略的局限性:
1. 开仓机会稀少的问题
开仓手数较少,较难满足开仓条件:这是道氏理论量化实现的一个重要缺陷。由于策略要求同时满足多个条件(趋势确认、回调到位、ADX过滤等),导致实际开仓机会远比预期的少。在某些时间段内,策略可能几个月都没有一次交易机会。
这对于追求高频交易或稳定现金流的投资者来说是个问题。在资金利用率方面,长期空仓状态显然不够理想。
2. 理论与现实的差距
经典理论适用于实盘,不一定完全准确:道氏理论诞生于一个多世纪前,当时的市场结构、参与者构成、信息传播速度都与现在大不相同。现代市场中的高频交易、程序化交易、各种衍生品工具的存在,都可能让经典理论的适用性打折扣。
特别是在短期时间框架内,市场噪音和随机性往往会掩盖道氏理论所揭示的规律。这就需要我们在应用时保持理性和谨慎。
3. 主观判断的必要性
需要人为的趋势判断:尽管我们努力将道氏理论量化,但在实际应用中,仍然需要大量的人工判断。比如:
- 什么时候应该调整参数?
- 在特殊的市场环境下(如疫情期间的异常波动)如何应对?
- 如何识别策略失效的信号?
这些问题都无法完全通过代码解决,需要交易者具备一定的市场经验和判断能力。对于完全依赖程序化交易的投资者来说,这可能是个挑战。
4. 品种选择的重要性
需要人工挑选时间和品种:正如黄金期货实现了完整的趋势捕捉所示,策略的成功很大程度上依赖于品种的选择和时机的把握。这带来几个问题:
- 选择偏差:我们很容易被回测中表现好的品种所吸引,但这可能只是数据挖掘的结果
- 时效性问题:某个品种在特定时期表现优秀,不代表在未来也会如此
- 组合难题:如何在多个品种间分配资金,如何处理相关性问题
5. 参数优化的挑战
需要实时跟进品种特性设置相关参数:不同品种需要不同的参数设置,这在实际应用中是个重大挑战:
- 参数漂移:市场特性会随时间变化,昨天的最优参数今天可能就不适用了
- 过度优化风险:频繁调整参数可能导致过度拟合历史数据
- 操作复杂性:管理多个品种的不同参数设置,对交易者的技术要求很高
6. 心理层面的挑战
除了技术层面的局限性,还有心理层面的挑战:
- 耐心考验:长期空仓或浮亏状态对交易者心理的考验
- 信心动摇:连续止损后对策略有效性的怀疑
- 纪律执行:在市场异常波动时严格执行策略规则的难度
改进建议
面对这些局限性,我建议:
- 分散投资:不要把所有资金都投入到单一策略中
- 持续监控:建立策略监控机制,及时发现问题
- 保持学习:市场在变化,我们的理解也要不断更新
- 风险为先:无论策略多么优秀,都要把风险控制放在第一位
- 适度期望:对策略收益保持合理预期,不要指望一夜暴富
总结
最后的提醒
虽然这个改进版本在回测中表现不错,但记住几点:
-
回测不等于实盘:真实交易中还有滑点、延迟等因素
-
参数需要定期检查:市场在变化,参数也要相应调整
-
风险控制永远第一:无论策略多么优秀,都要严格控制仓位和风险
-
保持学习心态:量化交易是一个不断学习和改进的过程
量化交易从来不是一个完美的解决方案,它只是我们理解和参与市场的一种工具。道氏理论的量化实现让我们对经典理论有了更深的理解,也让我们意识到理论与实践之间的差距。
真正的价值不在于找到一个完美的策略,而在于通过这个过程培养正确的交易思维:关注概率而非确定性,重视风险而非收益,保持谦逊而非自负。
希望这次的探索经验对大家有所帮助。量化交易的魅力就在于可以不断优化和完善,每一次改进都是对市场理解的深化。
- 1