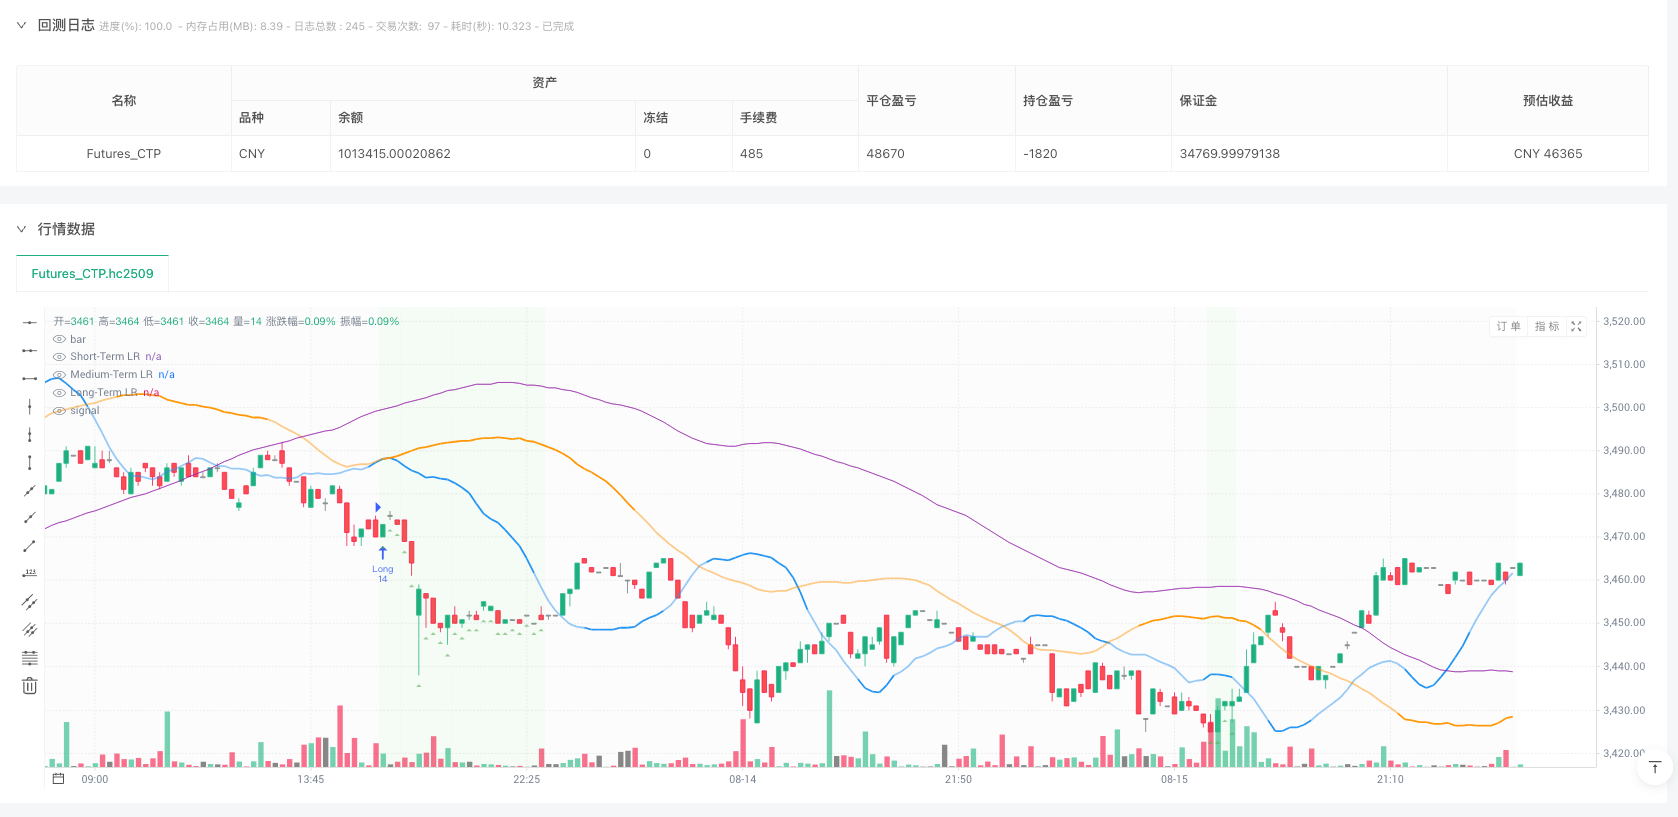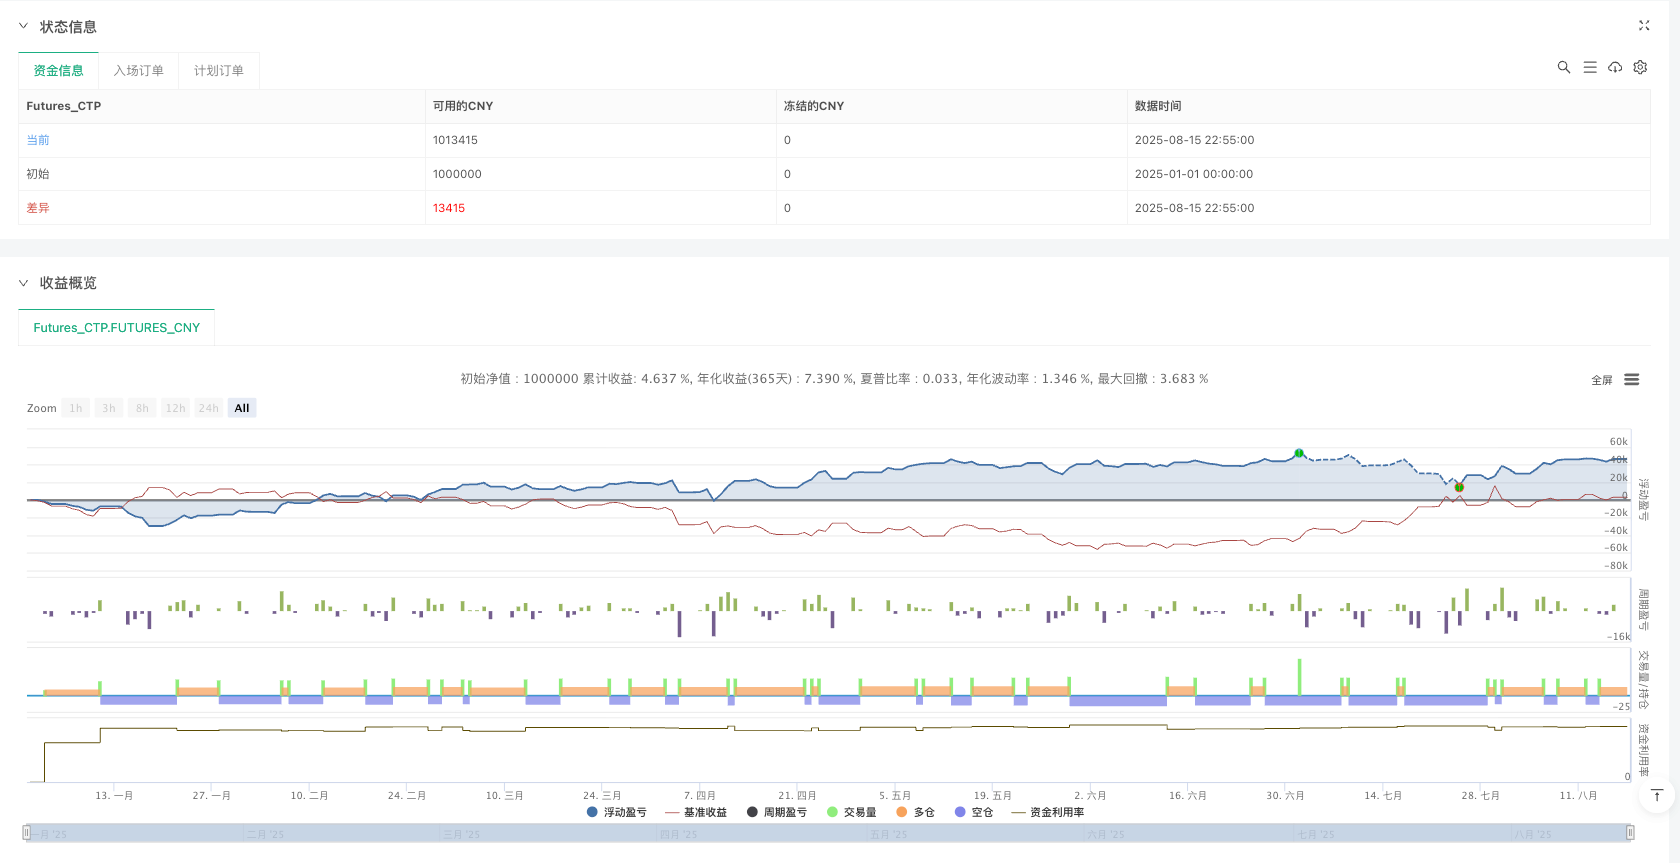

概述
多层次统计回归交易策略是一种先进的量化交易系统,它采用三层线性回归框架,结合统计验证和集成权重分配机制。该策略同时分析短期、中期和长期价格走势,通过严格的统计显著性测试生成高置信度的方向性信号,并实施严格的风险控制措施。策略核心在于将多个时间框架的线性回归分析结果进行加权整合,通过历史回溯验证来确保信号质量,并根据置信度动态调整仓位大小。
策略原理
该策略的核心原理是基于多层次统计线性回归分析,主要包括以下几个关键组成部分:
多层回归引擎: 策略在三个可自定义的时间框架(短期/中期/长期)上并行进行线性回归分析,默认分别为20/50/100个周期。通过计算每个时间框架的斜率、R平方值和相关系数等统计指标,预测未来价格走势。只有当R平方值、相关系数和斜率绝对值均超过预设阈值时,回归分析结果才被视为统计显著。
信号验证系统: 策略设计了一个回溯验证机制,通过比较历史预测值与实际价格走势来评估预测准确性。使用加权集成方法整合三个时间框架的信号,赋予短期、中期和长期信号不同的权重(默认为0.4⁄0.35⁄0.25)。综合置信度评分结合了统计强度、层间一致性和验证准确度。
风险管理机制: 策略根据信号置信度动态调整仓位大小(默认为账户资金的50%),设置每日最大亏损限制(默认为12%),当达到该限制时自动停止交易。同时考虑到外汇交易的特性,策略还包含了点差滑点和基于百分比的佣金设置。
信号生成逻辑要求集成得分绝对值大于0.5,总体置信度高于预设阈值(默认0.75),短期和中期回归必须统计显著,且每日亏损限制未被触发。当出现相反的高置信度信号或触发每日亏损限制时,策略会执行平仓操作。
策略优势
通过深入分析代码,该策略具有以下显著优势:
多维度市场分析: 通过同时分析短期、中期和长期价格走势,策略能够全面把握市场动态,避免单一时间框架可能带来的片面判断。
统计严谨性: 策略实施严格的统计显著性测试(R平方值、相关系数、斜率阈值),确保只有高质量的回归分析结果才会被用于信号生成,显著降低了虚假信号的可能性。
自适应仓位管理: 策略根据信号置信度动态调整仓位大小,在高置信度情况下增加仓位,低置信度情况下减少风险敞口,实现了风险与收益的智能平衡。
内置验证机制: 通过历史回溯验证来评估预测准确性,为信号质量提供了额外的保障层,有效提高了策略的稳定性和可靠性。
全面风险控制: 设置每日最大亏损限制,防止单日大幅度亏损,保护账户资金安全。当达到限制时自动停止交易,等待市场条件改善。
可视化决策支持: 策略提供实时回归线图表(三层不同颜色),短期预测标记,市场偏向背景色标识,以及全面的统计数据面板(R平方指标、验证分数、盈亏状况),为交易决策提供直观支持。
策略风险
尽管该策略设计精良,但仍存在以下潜在风险:
参数敏感性: 策略依赖多个关键参数(R平方阈值、相关系数最小值、斜率阈值等),这些参数的设置对策略表现有显著影响。不当的参数设置可能导致过度交易或错过重要信号。解决方法:通过历史数据回测优化参数设置,定期重新评估参数有效性。
市场条件变化: 在高波动性或突发事件期间,线性回归的预测能力可能显著下降,导致策略表现不佳。解决方法:增加市场状态识别机制,在非线性市场环境下自动调整或暂停交易。
统计滞后性: 线性回归分析本质上是滞后指标,在急剧转向的市场中可能反应不够迅速。解决方法:考虑整合领先指标或动量指标,提高策略对市场转折点的敏感度。
过度拟合风险: 多层次统计框架可能对历史数据过度拟合,导致在未来市场环境中表现不佳。解决方法:实施前向测试和交叉验证,确保策略的稳健性和适应性。
计算复杂性: 策略的多层回归分析和统计验证需要大量计算资源,在高频交易环境下可能面临执行延迟。解决方法:优化代码效率,考虑使用更高效的统计计算方法。
策略优化方向
基于代码分析,该策略可以在以下几个方向进行优化:
动态时间框架适应: 目前策略使用固定的短/中/长期时间框架长度,可以考虑根据市场波动性自动调整这些参数。在高波动市场中缩短时间框架,在低波动市场中延长时间框架,使策略更好地适应不同市场条件。
增强预测模型: 当前策略仅使用线性回归,可以考虑整合更复杂的模型如多项式回归、ARIMA或机器学习模型(如随机森林、支持向量机等),提高预测准确性。
市场环境分类: 增加市场环境识别模块,区分趋势市场和区间震荡市场,在不同市场环境下采用不同的交易逻辑和参数设置,提高策略的适应性。
优化验证机制: 当前的回溯验证主要基于短期预测,可以扩展到所有三个时间框架,并实施更复杂的验证方法,如滚动窗口交叉验证,提高验证的可靠性。
高级风险管理: 引入更复杂的风险管理技术,如动态止损水平、波动率调整的仓位大小、相关资产的风险平价等,进一步提高策略的风险调整后收益。
情绪和基本面整合: 考虑将市场情绪指标或基本面因素整合到模型中,如波动率指数、利率差异或经济数据发布的影响,创建更全面的交易决策框架。
总结
多层次统计回归交易策略是一个技术先进、设计周密的量化交易系统,它通过多层次线性回归分析结合严格的统计验证和智能风险控制,为交易决策提供了坚实的数学基础。该策略最大的优势在于其全面的市场分析能力和严谨的统计方法,通过同时考虑短期、中期和长期价格趋势,并对其进行统计显著性测试,有效过滤了低质量信号。
策略的集成加权机制和自适应仓位管理系统使其能够根据信号质量动态调整交易决策和风险敞口,而内置的回溯验证和每日损失限制提供了额外的安全保障。完善的可视化界面和统计数据面板也为交易者提供了直观的决策支持工具。
尽管该策略存在参数敏感性、市场条件适应性和统计滞后性等潜在风险,但通过定期参数优化、市场环境分类和预测模型增强等方向的优化,可以进一步提高其稳健性和盈利能力。总体而言,这是一个将量化金融技术与实用交易保障相结合的高级策略,特别适合对统计方法有一定了解的交易者使用。 ||
/*backtest
start: 2025-01-01 00:00:00
end: 2025-08-18 00:00:00
period: 5m
basePeriod: 5m
exchanges: [{"eid":"Futures_CTP","currency":"FUTURES"}]
args: [["ContractType","hc2509",360008]]
*/

//@version=5
strategy("Multi-Layer Statistical Regression Strategy - Optimized", overlay=true)

// === MULTI-LAYER REGRESSION INPUTS ===
// Linear Regression Layers
lr_short_length = input.int(20, "Short-Term LR Length", minval=10, maxval=50, step=2)
lr_medium_length = input.int(50, "Medium-Term LR Length", minval=30, maxval=100, step=5)
lr_long_length = input.int(100, "Long-Term LR Length", minval=50, maxval=200, step=10)

// === 优化后的统计验证参数 (降低严格程度) ===
min_r_squared = input.float(0.45, "Min R-Squared Threshold", minval=0.2, maxval=0.8, step=0.05)
slope_threshold = input.float(0.00005, "Min Slope Significance", minval=0.00001, maxval=0.001, step=0.00001)
correlation_min = input.float(0.5, "Min Correlation", minval=0.3, maxval=0.8, step=0.05)

// Lookback/Look-Forward Analysis
validation_lookback = input.int(30, "Validation Lookback", minval=10, maxval=60, step=5)
prediction_horizon = input.int(10, "Prediction Horizon", minval=5, maxval=20, step=1)

// Ensemble Weights
weight_short = input.float(0.4, "Short-Term Weight", minval=0.1, maxval=0.6, step=0.1)
weight_medium = input.float(0.35, "Medium-Term Weight", minval=0.1, maxval=0.6, step=0.05)
weight_long = input.float(0.25, "Long-Term Weight", minval=0.1, maxval=0.6, step=0.05)

// === 优化后的风险管理参数 ===
position_size_pct = input.float(50.0, "Position Size %", minval=10.0, maxval=100.0, step=5.0)
max_daily_loss = input.float(12.0, "Max Daily Loss %", minval=5.0, maxval=25.0, step=2.5)
confidence_threshold = input.float(0.55, "Signal Confidence Threshold", minval=0.4, maxval=0.8, step=0.05)

// === 新增:信号强度分级 ===
use_graded_signals = input.bool(true, "Use Graded Signal Strength")
strong_signal_threshold = input.float(0.7, "Strong Signal Threshold", minval=0.6, maxval=0.9, step=0.05)

// === STATISTICAL FUNCTIONS ===
// Calculate Linear Regression with full statistics
linear_regression_stats(src, length) =>
    var float sum_x = 0
    var float sum_y = 0
    var float sum_xy = 0
    var float sum_x2 = 0
    var float sum_y2 = 0

    // Reset sums
    sum_x := 0
    sum_y := 0
    sum_xy := 0
    sum_x2 := 0
    sum_y2 := 0

    // Calculate sums for regression
    for i = 0 to length - 1
        x = i + 1
        y = src[i]
        if not na(y)
            sum_x := sum_x + x
            sum_y := sum_y + y
            sum_xy := sum_xy + x * y
            sum_x2 := sum_x2 + x * x
            sum_y2 := sum_y2 + y * y

    n = length

    // Calculate regression coefficients
    denominator = n * sum_x2 - sum_x * sum_x
    slope = denominator != 0 ? (n * sum_xy - sum_x * sum_y) / denominator : 0
    intercept = (sum_y - slope * sum_x) / n

    // Calculate correlation coefficient (R)
    correlation = (n * sum_xy - sum_x * sum_y) /
                  math.sqrt((n * sum_x2 - sum_x * sum_x) * (n * sum_y2 - sum_y * sum_y))

    // Calculate R-squared
    r_squared = correlation * correlation

    // Current regression value
    current_lr = intercept + slope * n

    // Projected value (look-forward)
    projected_lr = intercept + slope * (n + prediction_horizon)

    [current_lr, slope, r_squared, correlation, projected_lr]

// === 优化后的统计显著性测试 (更灵活) ===
is_statistically_significant(r_squared, correlation, slope_abs, grade = "normal") =>
    if grade == "relaxed"
        r_squared >= (min_r_squared * 0.8) and math.abs(correlation) >= (correlation_min * 0.8) and math.abs(slope_abs) >= (slope_threshold * 0.5)
    else if grade == "strict"
        r_squared >= (min_r_squared * 1.2) and math.abs(correlation) >= (correlation_min * 1.1) and math.abs(slope_abs) >= (slope_threshold * 1.5)
    else
        r_squared >= min_r_squared and math.abs(correlation) >= correlation_min and math.abs(slope_abs) >= slope_threshold

// === MULTI-LAYER REGRESSION ANALYSIS ===
// Short-term layer
[lr_short, slope_short, r2_short, corr_short, proj_short] = linear_regression_stats(close, lr_short_length)
sig_short = is_statistically_significant(r2_short, corr_short, slope_short, "normal")
sig_short_strong = is_statistically_significant(r2_short, corr_short, slope_short, "strict")

// Medium-term layer
[lr_medium, slope_medium, r2_medium, corr_medium, proj_medium] = linear_regression_stats(close, lr_medium_length)
sig_medium = is_statistically_significant(r2_medium, corr_medium, slope_medium, "relaxed")
sig_medium_strong = is_statistically_significant(r2_medium, corr_medium, slope_medium, "normal")

// Long-term layer
[lr_long, slope_long, r2_long, corr_long, proj_long] = linear_regression_stats(close, lr_long_length)
sig_long = is_statistically_significant(r2_long, corr_long, slope_long, "relaxed")

// === LOOKBACK VALIDATION ===
validate_prediction_accuracy() =>
    var array<float> accuracy_scores = array.new<float>()

    if bar_index >= validation_lookback
        historical_slope = (close - close[prediction_horizon]) / prediction_horizon
        predicted_slope = slope_short[prediction_horizon]

        error = math.abs(historical_slope - predicted_slope)
        accuracy = math.max(0, 1 - error * 10000)

        array.push(accuracy_scores, accuracy)
        if array.size(accuracy_scores) > validation_lookback
            array.shift(accuracy_scores)

    array.size(accuracy_scores) > 5 ? array.avg(accuracy_scores) : 0.5

validation_accuracy = validate_prediction_accuracy()

// === 优化后的集成信号生成 ===
// Individual layer signals (directional)
signal_short = sig_short ? (slope_short > 0 ? 1 : -1) : 0
signal_medium = sig_medium ? (slope_medium > 0 ? 1 : -1) : 0
signal_long = sig_long ? (slope_long > 0 ? 1 : -1) : 0

// Weighted ensemble score
ensemble_score = (signal_short * weight_short +
                  signal_medium * weight_medium +
                  signal_long * weight_long)

// === 多级信号置信度计算 ===
// 基础一致性评分
agreement_score = math.abs(signal_short + signal_medium + signal_long) / 3.0

// 统计置信度 (使用加权平均)
stat_confidence = (r2_short * weight_short +
                   r2_medium * weight_medium +
                   r2_long * weight_long)

// 验证置信度
validation_confidence = validation_accuracy

// 整体置信度 (调整权重比例)
overall_confidence = (agreement_score * 0.3 +
                     stat_confidence * 0.5 +
                     validation_confidence * 0.2)

// 信号强度分级
signal_strength = math.abs(ensemble_score)
is_strong_signal = overall_confidence > strong_signal_threshold and (sig_short_strong or sig_medium_strong)

// === POSITION MANAGEMENT ===
trend_direction = ensemble_score > 0 ? 1 : ensemble_score < 0 ? -1 : 0

// 基于信号强度的仓位调整
confidence_multiplier = if use_graded_signals
    if is_strong_signal
        1.0 + (overall_confidence - strong_signal_threshold) * 0.5
    else
        0.7 + (overall_confidence / strong_signal_threshold) * 0.3
else
    overall_confidence > confidence_threshold ? 1.0 : overall_confidence / confidence_threshold

base_position_value = strategy.equity * (position_size_pct / 100)
adjusted_position_value = base_position_value * confidence_multiplier
position_units = adjusted_position_value / (close * syminfo.pointvalue)

// Daily loss tracking
var float daily_start_equity = strategy.equity
if ta.change(time("1D"))
    daily_start_equity := strategy.equity

current_daily_loss = daily_start_equity > 0 ? (daily_start_equity - strategy.equity) / daily_start_equity * 100 : 0
halt_trading = current_daily_loss > max_daily_loss

// === 优化后的入场/退出逻辑 ===
// 更灵活的入场条件
long_condition_basic = ensemble_score > 0.2 and overall_confidence > confidence_threshold and sig_short
long_condition_strong = ensemble_score > 0.4 and overall_confidence > strong_signal_threshold and sig_short and sig_medium

short_condition_basic = ensemble_score < -0.2 and overall_confidence > confidence_threshold and sig_short
short_condition_strong = ensemble_score < -0.4 and overall_confidence > strong_signal_threshold and sig_short and sig_medium

// 入场信号生成
long_signal = use_graded_signals ? (long_condition_strong or long_condition_basic) : long_condition_strong
short_signal = use_graded_signals ? (short_condition_strong or short_condition_basic) : short_condition_strong

// 策略执行
if long_signal and not halt_trading and strategy.position_size <= 0
    signal_type = long_condition_strong ? "Strong Long" : "Basic Long"
    strategy.entry("Long", strategy.long, qty=position_units,
                   comment=signal_type + ": " + str.tostring(overall_confidence, "#.##"))

if short_signal and not halt_trading and strategy.position_size >= 0
    signal_type = short_condition_strong ? "Strong Short" : "Basic Short"
    strategy.entry("Short", strategy.short, qty=position_units,
                   comment=signal_type + ": " + str.tostring(overall_confidence, "#.##"))

// 降低初始化门槛
if strategy.position_size == 0 and not halt_trading and barstate.isconfirmed
    if ensemble_score > 0.15 and overall_confidence > (confidence_threshold * 0.8)
        strategy.entry("InitLong", strategy.long, qty=position_units * 0.8, comment="Init Long")
    else if ensemble_score < -0.15 and overall_confidence > (confidence_threshold * 0.8)
        strategy.entry("InitShort", strategy.short, qty=position_units * 0.8, comment="Init Short")

// Emergency exit
if halt_trading and strategy.position_size != 0
    strategy.close_all(comment="Daily Loss Limit")

// === 增强的可视化 ===
// Plot regression lines with transparency based on significance
plot(lr_short, "Short-Term LR", color=sig_short_strong ? color.blue : color.new(color.blue, 50), linewidth=2)
plot(lr_medium, "Medium-Term LR", color=sig_medium_strong ? color.orange : color.new(color.orange, 50), linewidth=2)
plot(lr_long, "Long-Term LR", color=color.new(color.purple, 30), linewidth=1)

// Background with graded confidence
bg_color = if overall_confidence > strong_signal_threshold
    ensemble_score > 0 ? color.new(color.green, 85) : color.new(color.red, 85)
else if overall_confidence > confidence_threshold
    ensemble_score > 0 ? color.new(color.green, 92) : color.new(color.red, 92)
else
    color.new(color.gray, 97)

bgcolor(bg_color)

// Enhanced signal markers
plotshape(long_condition_strong, "Strong Long", shape.triangleup, location.belowbar,
          color=color.green, size=size.large)
plotshape(long_condition_basic and not long_condition_strong, "Basic Long", shape.triangleup, location.belowbar,
          color=color.new(color.green, 40), size=size.small)

plotshape(short_condition_strong, "Strong Short", shape.triangledown, location.abovebar,
          color=color.red, size=size.large)
plotshape(short_condition_basic and not short_condition_strong, "Basic Short", shape.triangledown, location.abovebar,
          color=color.new(color.red, 40), size=size.small)