概述
本策略是一个基于布林带指标的自适应趋势反转交易系统。它通过监测价格与布林带的交叉来捕捉市场的超买超卖机会,结合均值回归原理进行交易。策略采用动态仓位管理和风险控制机制,适用于多个市场和时间周期。
策略原理
策略的核心逻辑基于以下几点: 1. 使用20周期移动平均线作为布林带的中轨,并以2倍标准差计算上下轨。 2. 当价格突破下轨时,视为超卖信号,开立多头仓位。 3. 当价格突破上轨时,视为超买信号,开立空头仓位。 4. 当价格回归中轨时,平仓获利。 5. 设置1%止损和2%止盈,实现2:1的风险收益比。 6. 采用账户资金比例进行仓位管理,每次交易投入1%的资金。
策略优势
- 指标选择科学 - 布林带结合了趋势和波动率信息,能有效识别市场状态。
- 风控机制完善 - 采用固定风险收益比和百分比止损,有效控制风险。
- 自适应性强 - 布林带会根据市场波动自动调整带宽,适应不同市场环境。
- 操作规则明确 - 入场、出场条件清晰,减少主观判断。
- 实时监控优势 - 具备声音提醒功能,方便跟踪交易信号。
策略风险
震荡市风险 - 在横盘市场可能频繁交易导致损失。 解决方案:增加趋势过滤器,只在趋势明确时交易。
假突破风险 - 价格可能在突破后快速反转。 解决方案:添加确认信号,如成交量或其他技术指标验证。
系统性风险 - 在极端市场条件下可能遭受较大损失。 解决方案:设置最大回撤限制,达到阈值自动停止交易。
策略优化方向
- 动态带宽优化
- 根据市场波动率自动调整布林带标准差倍数
- 在不同波动环境下提高策略适应性
- 多重时间周期分析
- 增加更高时间周期的趋势判断
- 提高交易方向的准确性
- 智能仓位管理
- 根据历史波动率动态调整持仓比例
- 优化资金利用效率
总结
该策略通过布林带指标捕捉价格偏离度,结合均值回归原理进行交易。完善的风控机制和清晰的交易规则使其具有良好的实用性。通过建议的优化方向,可进一步提升策略的稳定性和盈利能力。策略适合追求稳健收益的量化交易者使用。 ||
策略源码
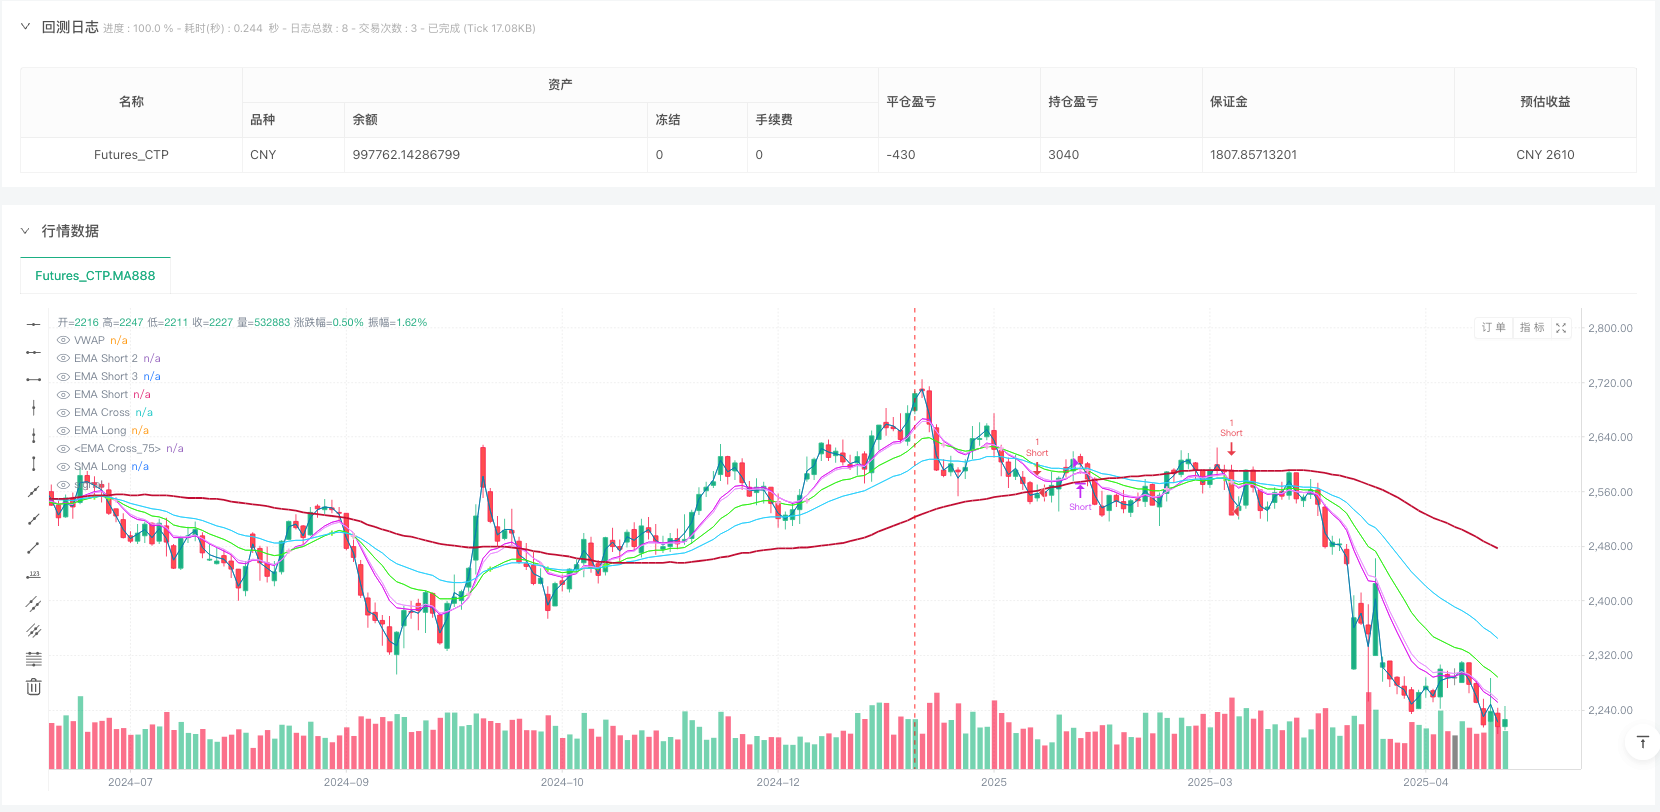
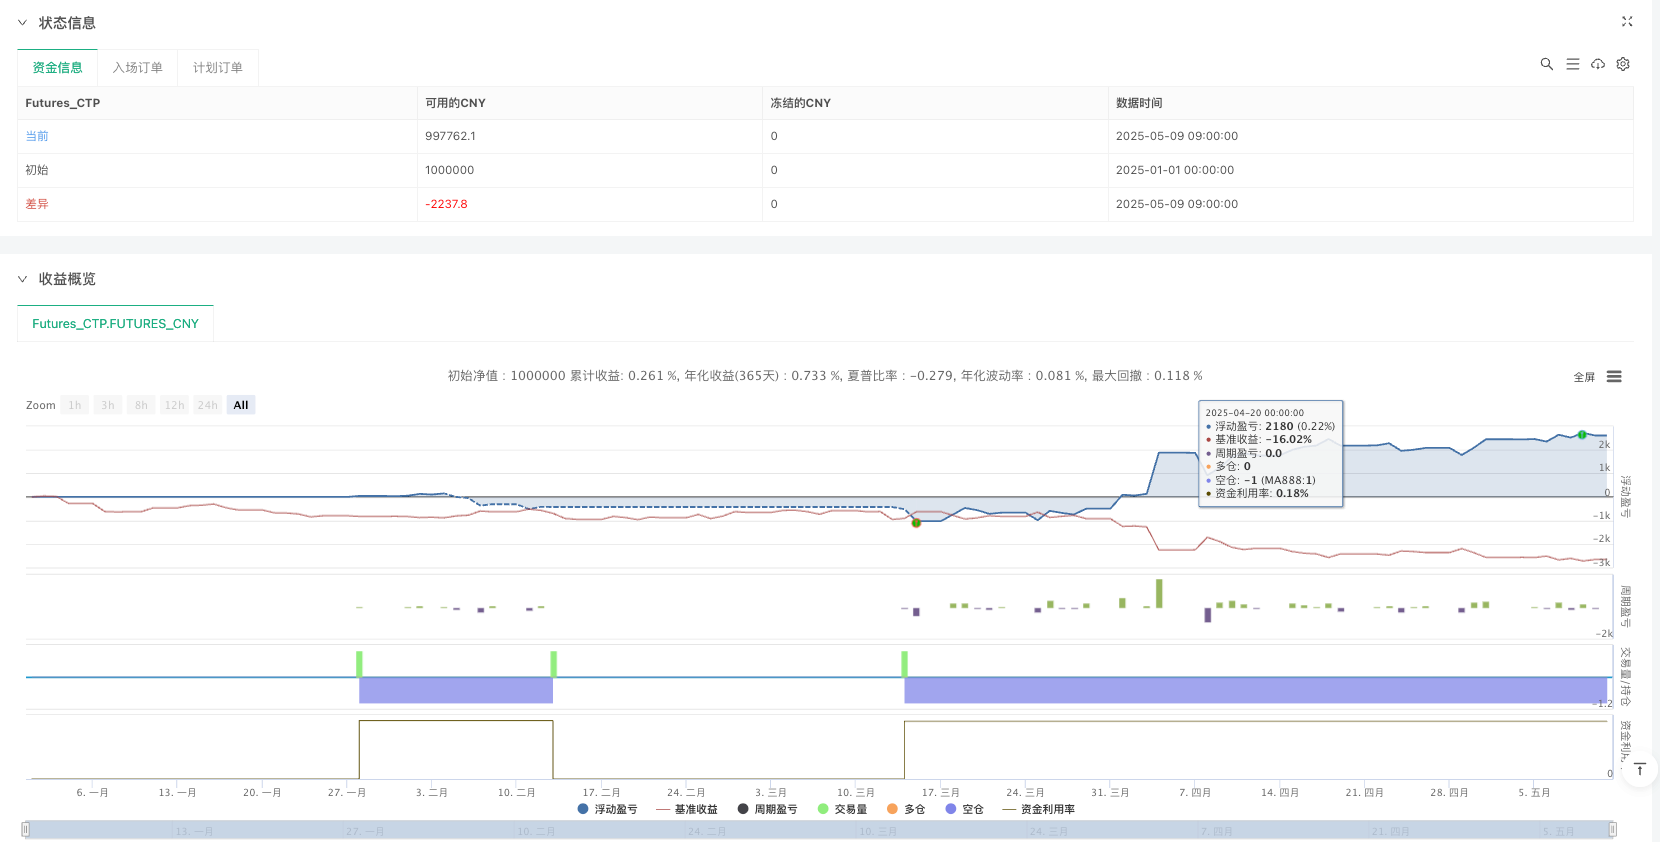
/*backtest
start: 2025-01-01 00:00:00
end: 2025-05-11 00:00:00
period: 1d
basePeriod: 1d
exchanges: [{"eid":"Futures_CTP","currency":"FUTURES"}]
*/


//@version=5
strategy("EMA+SMA+VWAP Trading Strategy ", overlay=true)

// Inputs
emaShortPeriod = input.int(17, title="EMA Entry Short")
emaLongPeriod = input.int(31, title="EMA Entry Long")
smaPeriod = input.int(69, title="SMA Longest")
emaShortPeriod2 = input.int(8, title="EMA Exit Small")
emaShortPeriod3 = input.int(9, title="EMA Exit Long")

// Calculate Indicators
emaShort = ta.ema(close, emaShortPeriod)
emaShort2 = ta.ema(close, emaShortPeriod2)
emaShort3 = ta.ema(close, emaShortPeriod3)
emaLong = ta.ema(close, emaLongPeriod)
vwap = ta.vwap(hlc3)
smalong = ta.sma(close, smaPeriod)

// Define Conditions
long_condition = ta.crossover(emaShort, emaLong) and close > vwap and close > smalong
short_condition = ta.crossunder(emaShort, emaLong) and close < vwap and close < smalong
long_exit_condition = ta.crossunder(emaShort2, emaShort3)
short_exit_condition = ta.crossover(emaShort2, emaShort3)

// Position Tracking
var bool long_active = false
var bool short_active = false

// Execute Trades with Reversal Logic
// Long Entry: Open long and close short if active
if long_condition
    if short_active
        strategy.close("Short")  // Close short (buy to cover)
        short_active := false
    if not long_active
        strategy.entry("Long", strategy.long)  // Open long
        long_active := true

// Short Entry: Open short and close long if active
if short_condition
    if long_active
        strategy.close("Long")  // Close long (sell)
        long_active := false
    if not short_active
        strategy.entry("Short", strategy.short)  // Open short
        short_active := true

// Normal Exits (no reversal)
if long_active and long_exit_condition and not short_condition
    strategy.close("Long")  // Sell to close long
    long_active := false

if short_active and short_exit_condition and not long_condition
    strategy.close("Short")  // Buy to close short
    short_active := false

// Plot Indicators
plot(emaShort, color=color.rgb(48, 240, 23), title="EMA Short")
plot(emaLong, color=color.rgb(39, 209, 252), title="EMA Long")
plot(vwap, color=color.rgb(8, 128, 175), title="VWAP")
plot(smalong, color=color.rgb(194, 12, 51), linewidth=2, title="SMA Long")
plot(ta.cross(emaShort, emaLong) ? emaShort : na, style=plot.style_cross, color=color.rgb(126, 248, 45), linewidth=3, title="EMA Cross")
plot(emaShort2, color=color.rgb(222, 23, 240), title="EMA Short 2")
plot(emaShort3, color=color.rgb(234, 148, 255), title="EMA Short 3")
plot(ta.cross(emaShort2, emaShort3) ? emaShort : na, style=plot.style_cross, color=color.rgb(250, 170, 230), linewidth=3, title="EMA Cross")