过程 - 扫描趋势中的数据透视。这意味着,以升序或降序排列的一系列枢轴高点或枢轴低点。 - 在趋势序列中的每个枢轴之间绘制趋势线。例如,如果有5个pivot high uptrend pivot,请在每个点之间绘制mXn线。 - 选择更准确或更强的趋势线。准确度是通过接触线的蜡烛/灯芯的数量和落在线外的蜡烛的数量来衡量的。更强的趋势线将接触更多蜡烛和枢轴,溢出更少。 - 除去每个方向最精确的线以外的所有线。
在任何时候,您都可以在此脚本中看到多达4条趋势线。
旧的线路将一直保留,直到新的线路通过相同类型的线路。因此,您仍然可以看到很久以前创建的下降趋势工具的上升和下降趋势线!!此外,只有当旧趋势线更强时,新趋势线才会取代旧趋势线(连接到更多枢轴,溢出更少)
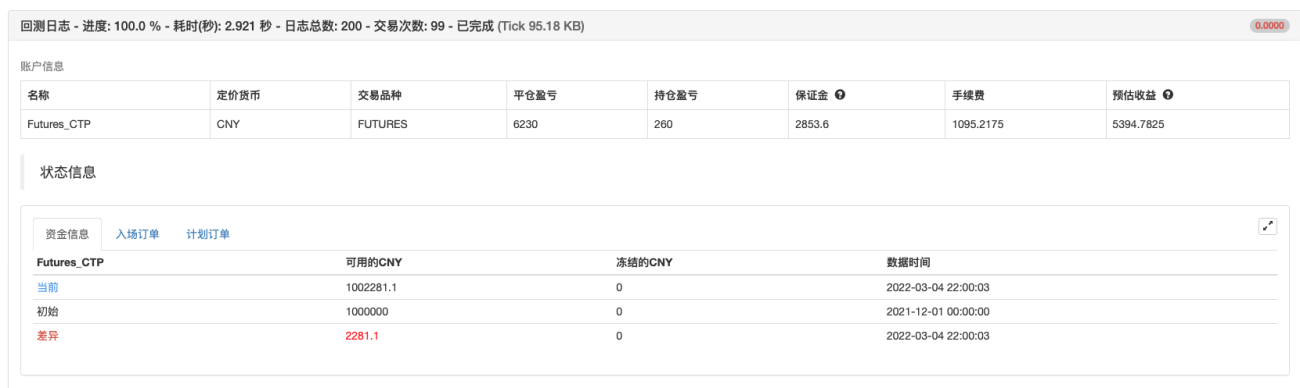
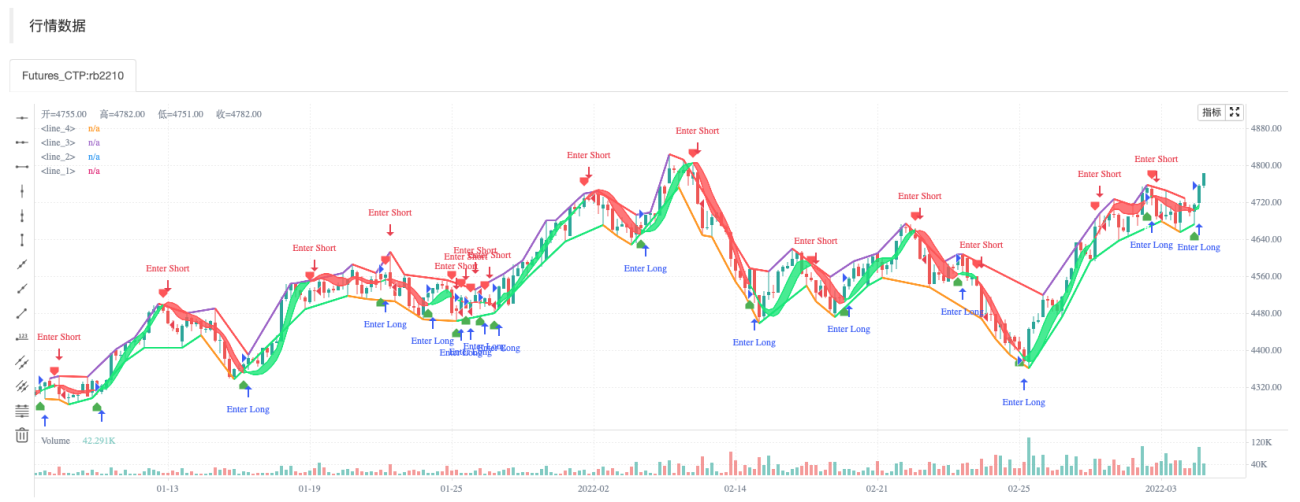
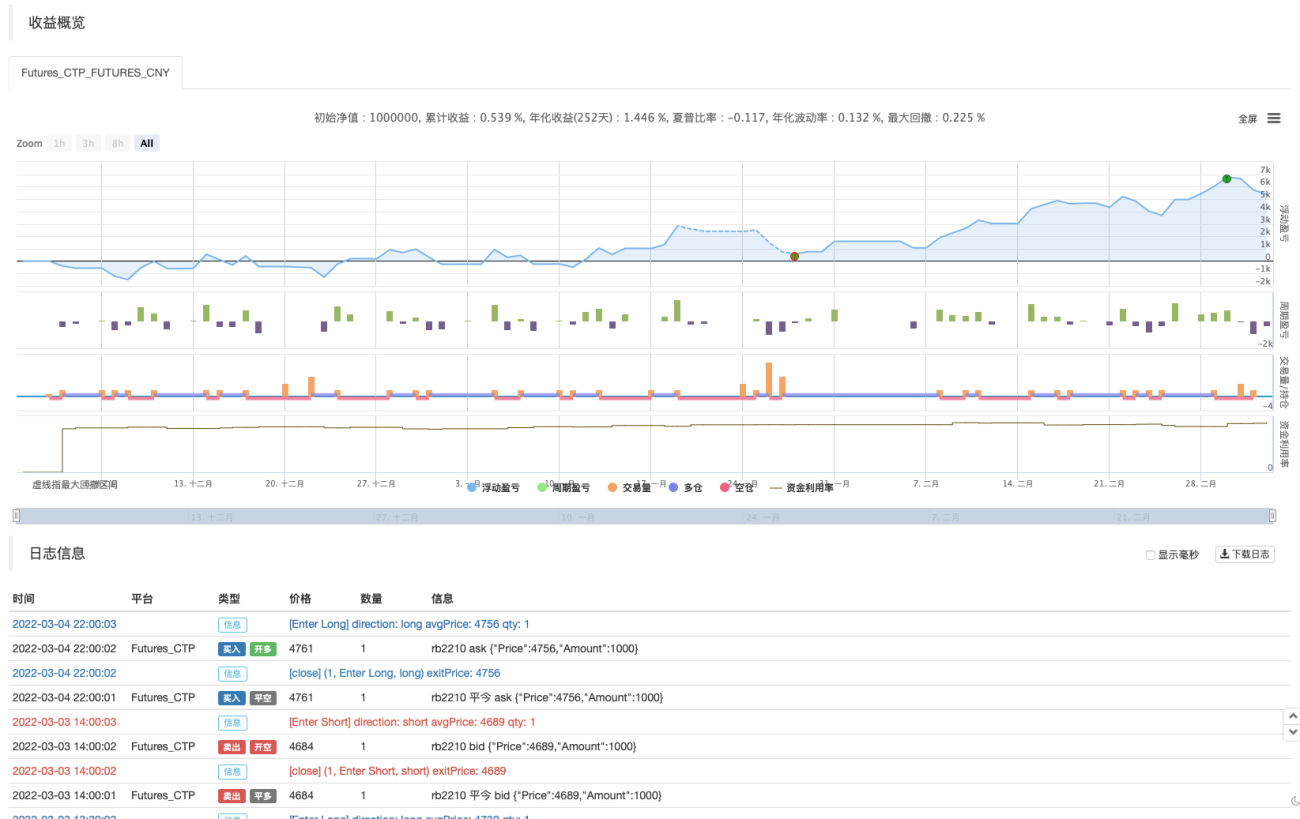
回测测试
/*backtest
start: 2021-12-01 00:00:00
end: 2022-03-05 00:00:00
period: 1h
basePeriod: 15m
exchanges: [{"eid":"Futures_CTP","currency":"FUTURES"}]
args: [["ContractType","rb2210",360008]]
*/
//@version=4
study("BRAHMASTRA", precision=2, overlay=true)
// compilation: capissimo
// This script utilizes two modules, Trendlines Module (by Joris Duyck) and HMA-Kahlman Trend Module.
// Trendlines module produces crossovers predictive of the next local trend.
//*** HMA-Kahlman Trend Module
price = input(hl2, "价格数据(默认hl2)")
hkmod = input(true, "===HMA-Kahlman 趋势模型===")
length = input(22, "回看窗口周期", minval=2)
k = input(true, "使用Kahlman")
gain = input(.7, "赢得", minval=.0001, step=.01)
labels = input(true, "显示标签?")
o = input(true, "使用偏移")
hma(x, p) => wma((2 * wma(x, p / 2)) - wma(x, p), round(sqrt(p)))
hma3() => p = length/2, wma(wma(close, p/3)*3 - wma(close, p/2) - wma(close, p), p)
kahlman(x, g) =>
kf = 0.0
dk = x - nz(kf[1], x)
smooth = nz(kf[1],x)+dk*sqrt(g*2)
velo = 0.0
velo := nz(velo[1],0) + (g*dk)
kf := smooth+velo
a = k ? kahlman(hma(price, length), gain) : hma(price, length)
b = k ? kahlman(hma3(), gain) : hma3()
c = b > a ? color.lime : color.red
crossdn = a > b and a[1] < b[1]
crossup = b > a and b[1] < a[1]
ofs = o ? -1 : 0
fill(plot(a,color=c,linewidth=1,transp=75), plot(b,color=c,linewidth=1,transp=75), color=c, transp=55)
plotshape(labels and crossdn ? a : na, location=location.abovebar, style=shape.labeldown, color=color.red, size=size.tiny, text="S", textcolor=color.white, transp=0, offset=ofs)
plotshape(labels and crossup ? a : na, location=location.belowbar, style=shape.labelup, color=color.green, size=size.tiny, text="B", textcolor=color.white, transp=0, offset=ofs)
//*** Trendlines Module, see https://www.tradingview.com/script/mpeEgn5J-Trendlines-JD/
tlmod = input(true, "===趋势线模型===")
l1 = input(2, "枢轴点回看窗口周期", minval=1)
trendline(input_function, delay, only_up) => // Calculate line coordinates (Ax,Ay) - (Bx,By)
var int Ax = 0, var int Bx = 0, var float By = 0.0, var float slope = 0.0
Ay = fixnan(input_function)
if change(Ay)!=0
Ax := time[delay], By:= Ay[1], Bx := Ax[1]
slope := ((Ay-By)/(Ax-Bx))
else
Ax := Ax[1], Bx := Bx[1], By := By[1]
var line trendline=na, var int Axbis=0, var float Aybis=0.0, var bool xtend=true
extension_time = 0
Axbis := Ax + extension_time
Aybis := (Ay + extension_time*slope)
if tlmod and change(Ay)!=0
line_color = slope*time<0?(only_up?na:color.red):(only_up?color.lime:na)
if not na(line_color)
trendline = line.new(Bx,By,Axbis, Aybis, xloc.bar_time, extend=xtend?extend.right:extend.none, color=line_color, style=line.style_dotted, width=1)
line.delete(trendline[1])
slope
pivot(len) =>
high_point = pivothigh(high, len,len/2)
low_point = pivotlow(low, len,len/2)
slope_high = trendline(high_point, len/2,false)
slope_low = trendline(low_point, len/2,true)
[high_point, low_point, slope_high, slope_low]
[high_point1, low_point1, slope_high1, slope_low1] = pivot(l1)
color_high1 = slope_high1 * time<0 ? color.red : na
color_low1 = slope_low1 * time>0 ? color.lime : na
plot(tlmod ? high_point1 : na, color=color_high1, offset=-l1/2, linewidth=2)
plot(tlmod ? low_point1 : na, color=color_low1, offset=-l1/2, linewidth=2)
if crossup
strategy.entry("Enter Long", strategy.long)
else if crossdn
strategy.entry("Enter Short", strategy.short)