#### Overview The Enhanced Doji Candlestick Trend Reversal Quantitative Trading Strategy is a market reversal identification system based on Doji candlestick patterns. This strategy captures potential market reversal points by identifying moments of market indecision (Doji formations) and combining them with a short-term Simple Moving Average (SMA) to confirm the overall market trend. The strategy employs a flexible entry confirmation mechanism and strict risk management principles, including automatic stop-loss, profit targets based on risk ratios, and early exit mechanisms, ensuring stability across different market environments.
Strategy Principles
The core principle of this strategy is based on using Doji candlestick patterns as signals for potential market reversals. A Doji candlestick occurs when the opening and closing prices are almost identical (or very close), indicating a state of equilibrium between buying and selling forces in the market. In the code implementation, Dojis are identified through the defineDoji(threshold) function, which calculates the ratio between the candle body (absolute difference between closing and opening prices) and the overall candle range (high minus low), determining a Doji when this ratio is below the set threshold.
The strategy uses a Simple Moving Average (SMA) with a period of 20 as a trend confirmation tool. When the price is above the SMA, the trend is considered bullish; when the price is below the SMA, the trend is considered bearish. This design allows the strategy to seek entry points in the direction of the trend, avoiding counter-trend trading.
The entry signal confirmation process is as follows: 1. First, identify a Doji candlestick pattern (using a more relaxed threshold of 0.3) 2. Then wait for 1-2 confirmation candles to appear - Bullish confirmation: closing price higher than opening price, with relatively short lower wicks (allowing up to 0.99 times the opening price) - Bearish confirmation: closing price lower than opening price, with relatively short upper wicks (allowing up to 1.01 times the opening price) 3. When these conditions are met, enter at market price
For risk management, the strategy sets a fixed stop-loss distance of 5 pips and uses a 2:1 risk-reward ratio to set take-profit levels. Additionally, when a reverse Doji pattern forms in the opposite direction of the trade, the strategy immediately closes the position to minimize potential losses.
Strategy Advantages
Through in-depth analysis of the strategy’s code, the following main advantages can be summarized:
Precision in Signal Identification: The strategy enhances signal accuracy through a dual filtering mechanism of Doji patterns and trend confirmation. Dojis indicate market indecision, and when combined with confirmation candles in the trend direction, this effectively filters out low-quality signals.
Flexible Parameter Adjustment: The code includes multiple adjustable parameters, such as risk-reward ratio, stop-loss points, SMA period, etc., allowing traders to optimize according to different market environments and personal risk preferences.
Comprehensive Risk Management: The strategy incorporates a complete risk management system, including automatic stop-loss, profit targets based on risk ratios, and early exit mechanisms, effectively controlling risk exposure for each trade.
Signal Frequency Optimization: By relaxing the Doji detection criteria (threshold 0.3) and confirmation conditions (allowing small wicks), the strategy increases trading frequency while maintaining risk management principles.
Combination of Trend Following and Reversal: The strategy cleverly combines the advantages of trend following (SMA trend confirmation) and reversal trading (Doji patterns), enabling it to capture opportunities when trends change.
Clean and Efficient Code Implementation: The Pine Script implementation is concise and clear, using built-in indicators for trend detection, reducing computational complexity and improving efficiency in backtesting and live execution.
Strategy Risks
Despite its many advantages, the strategy also has some potential risks and challenges:
False Signal Risk: Lowering the Doji detection threshold (0.3) increases trading frequency but also increases the possibility of false signals. In highly volatile markets, this may lead to overtrading and unnecessary losses. Solution: Consider increasing the threshold during high volatility periods or adding additional filtering conditions, such as volume confirmation or volatility indicator screening.
Fixed Stop-Loss Risk: Using a fixed number of points (5 pips) as a stop-loss may perform inconsistently in different volatility environments. In highly volatile markets, the stop-loss may be too tight; in low volatility markets, the risk may be too large. Solution: Implement dynamic stop-loss settings based on ATR (Average True Range) to adapt stop-loss distances to market volatility.
Trend Identification Lag: Using SMA as a trend confirmation tool has inherent lag, which may cause missed optimal entry opportunities near trend turning points. Solution: Consider using more sensitive trend indicators, such as EMA (Exponential Moving Average) or adaptive moving averages, or combine multi-timeframe analysis to reduce lag.
Market Noise Interference: In ranging markets, Doji patterns may appear frequently but not represent true reversal signals, potentially leading to consecutive losing trades. Solution: Add market structure analysis, such as identifying support/resistance levels, or include volatility filters before confirming entries.
Double-Edged Effect of Early Exit Mechanism: The mechanism of immediately closing positions when a reverse Doji appears may lead to premature exits from profitable trades in volatile markets. Solution: Consider implementing a partial profit-taking strategy based on drawdown percentages, or use trailing stops to protect profits while giving prices some breathing room.
Strategy Optimization Directions
Based on code analysis, here are several possible optimization directions:
Dynamic Stop-Loss Mechanism: Replace fixed point stop-loss with ATR-based dynamic stop-loss to make risk control more adaptable to market volatility. This provides wider stop-loss space during high volatility periods and tighter stop-loss during low volatility periods, matching risk exposure to market conditions.
Multi-Timeframe Confirmation: Add higher timeframe trend analysis to ensure trade direction aligns with the larger trend. By combining short-term and long-term trend analysis, the frequency of counter-trend trades can be reduced, improving overall win rate.
Volume Confirmation: Include volume analysis in entry signal confirmation, considering valid signals only when Dojis are accompanied by abnormal trading volume. Volume is a confirming factor for price movements; adding this condition can enhance the reliability of reversal signals.
Market Environment Filtering: Add market environment identification mechanisms to adjust strategy parameters or pause trading during high volatility or strong trend environments. Strategy effectiveness varies significantly across different market environments; automatic adjustment can improve overall stability.
Partial Profit Locking: Implement a tiered profit-taking mechanism, partially closing positions when prices reach specific profit levels, with trailing stops for remaining positions. This approach can reduce drawdown risk while maintaining profit capture potential.
Machine Learning Optimization: Utilize machine learning algorithms to optimize Doji detection thresholds and confirmation conditions based on historical data, adapting to different markets and timeframes. Data-driven parameter optimization can significantly enhance strategy adaptability and robustness.
Additional Filtering Conditions: Consider adding extra technical indicators as filters, such as RSI (Relative Strength Index) or Bollinger Bands, to reduce false signals. Multiple confirmation systems can effectively improve signal quality, especially in reversal trading strategies.
Summary
The Enhanced Doji Candlestick Trend Reversal Quantitative Trading Strategy is a trading system that combines classic technical analysis patterns with modern quantitative methods. By identifying Doji patterns in the market and incorporating trend confirmation and strict risk management, the strategy can capture potential market reversal points while controlling trading risk.
The core advantages of the strategy lie in its flexible parameter settings, comprehensive risk management system, and signal frequency optimization, enabling it to adapt to different market environments. However, attention must also be paid to potential issues such as false signal risk, limitations of fixed stop-loss, and lag in trend identification.
Through implementation of dynamic stop-loss mechanisms, multi-timeframe confirmation, volume analysis, and market environment filtering, the strategy’s robustness and long-term performance can be further enhanced. Ultimately, this strategy based on market structure and behavior provides quantitative traders with a trading framework that reasonably balances risk and reward, suitable as a foundation for medium to long-term trading systems or as part of a strategy portfolio.
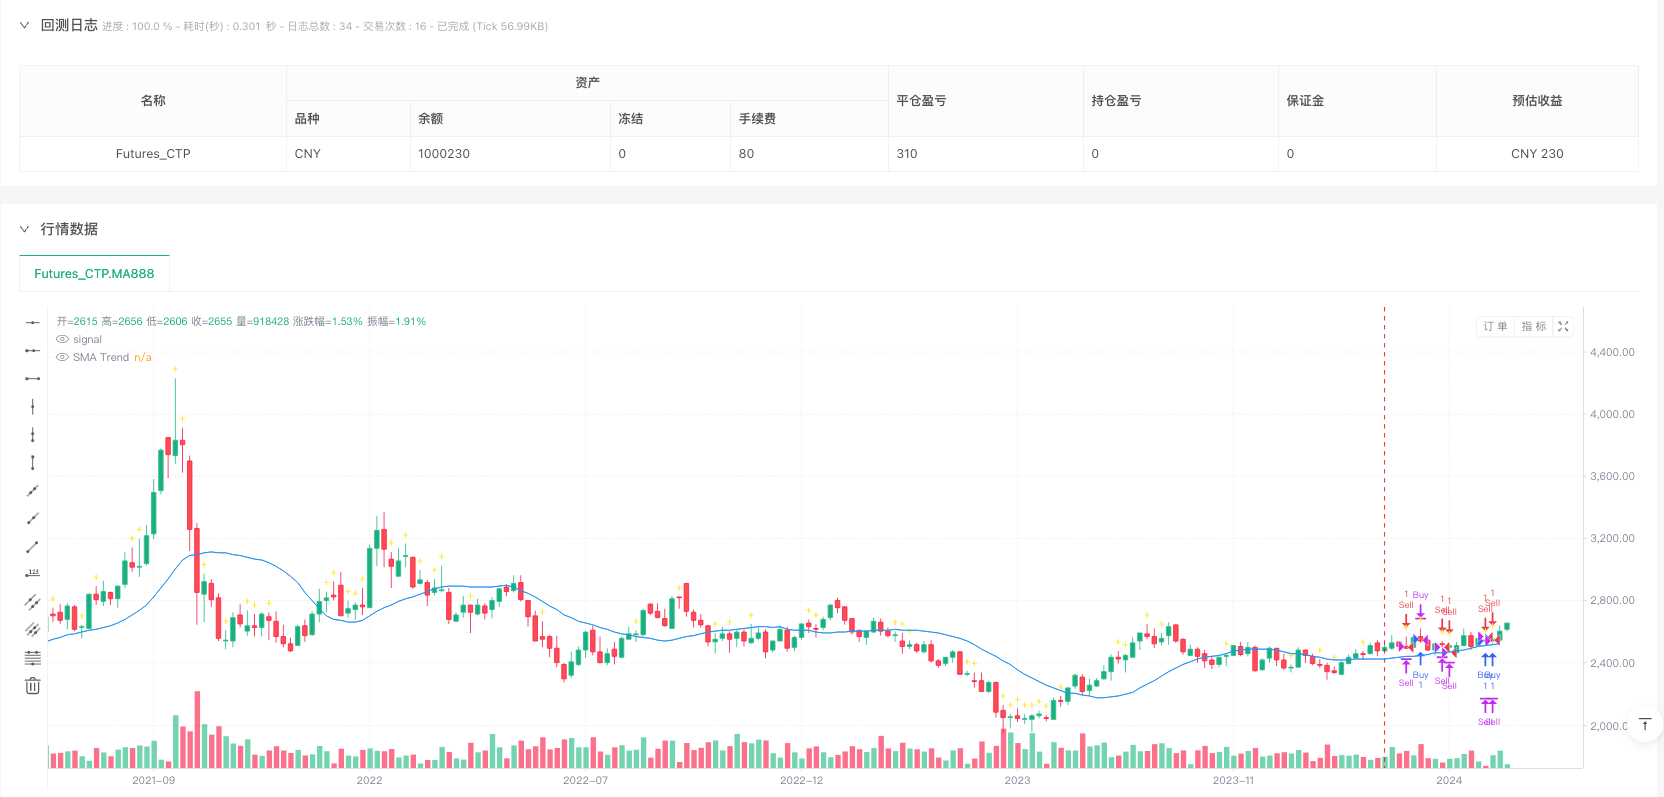
/*backtest
start: 2024-02-26 00:00:00
end: 2024-05-19 00:00:00
period: 5d
basePeriod: 1d
exchanges: [{"eid":"Futures_CTP","currency":"FUTURES"}]
*/

// Enhanced Doji Candle Trading Strategy in Pine Script
//@version=5
strategy("Enhanced Doji Candle Strategy", overlay=true)

// Parameters
riskRewardRatio = input.float(2.0, title="Risk-Reward Ratio")
stopLossPips = input.int(5, title="Stop Loss (in pips)")  // Reduced to allow more trades

defineDoji(threshold) =>
    body = math.abs(close - open)
    candleRange = high - low
    body <= (candleRange * threshold)

// Detect Doji candle with a higher threshold for more signals
doji = defineDoji(0.3)  // Less strict detection

// Determine Market Trend Using Shorter Moving Average
smaPeriod = input.int(20, title="SMA Period")  // Shorter period for faster signals
sma = ta.sma(close, smaPeriod)
bullishTrend = close > sma
bearishTrend = close < sma

// Confirmation of Entry with Looser Requirements
// Allow small wicks (up to 10% of the candle range)
bullishConfirm = close > open and (low >= open * 0.99)
bearishConfirm = close < open and (high <= open * 1.01)

// Trade Entry Logic
if doji
    if bullishConfirm or bullishConfirm[1]  // Loosen confirmation to 1 candle
        entryPrice = close
        stopLossPrice = entryPrice - (stopLossPips * syminfo.mintick)
        takeProfitPrice = entryPrice + ((entryPrice - stopLossPrice) * riskRewardRatio)
        strategy.entry("Buy", strategy.long)
        strategy.exit("Exit Buy", "Buy", stop=stopLossPrice, limit=takeProfitPrice)

    if bearishConfirm or bearishConfirm[1]  // Loosen confirmation to 1 candle
        entryPrice = close
        stopLossPrice = entryPrice + (stopLossPips * syminfo.mintick)
        takeProfitPrice = entryPrice - ((stopLossPrice - entryPrice) * riskRewardRatio)
        strategy.entry("Sell", strategy.short)
        strategy.exit("Exit Sell", "Sell", stop=stopLossPrice, limit=takeProfitPrice)

// Early Exit on Reversal Signal
reversalDoji = doji
if reversalDoji
    strategy.close("Buy")
    strategy.close("Sell")

// Plotting
plotshape(doji, style=shape.cross, color=color.yellow, title="Doji Candle")
plot(sma, color=color.blue, title="SMA Trend")