Volatility-Filtered Dual EMA Crossover High Sharpe Ratio Strategy

Overview
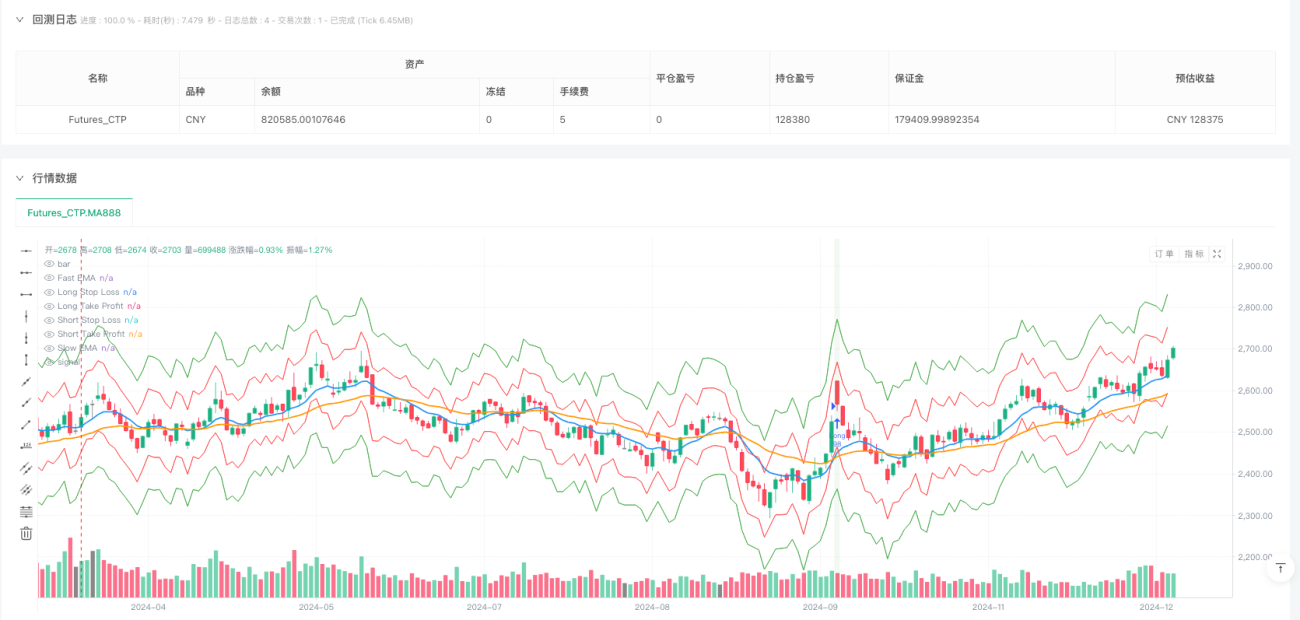
This strategy is a quantitative trading system based on dual Exponential Moving Average (EMA) crossovers and Average True Range (ATR) filtering, specifically designed for high volatility market environments. It combines the advantages of trend following and volatility filtering to seek optimal risk-adjusted returns in high IV (Implied Volatility) markets. The core of the strategy is to determine trend direction through golden crosses and death crosses between the fast EMA (10-day) and slow EMA (30-day), while using ATR and its related derivative indicators to identify high volatility market environments, ensuring trades are only entered when volatility is sufficiently high, thereby improving the Sharpe Ratio.
Strategy Principles
The strategy is based on a combination of two core technical indicators:
-
Trend Indicators:
- Fast Exponential Moving Average (EMA_fast): 10-day EMA, used to capture short-term trend changes
- Slow Exponential Moving Average (EMA_slow): 30-day EMA, used to determine long-term trend direction
-
Volatility Indicators:
- Average True Range (ATR): 14-day ATR, measures market volatility
- ATR Mean (ATR_mean): Simple moving average of 20-day ATR, serves as a volatility benchmark
- ATR Standard Deviation (ATR_std): Standard deviation of 20-day ATR, used to judge extreme volatility changes
The strategy's trading logic is clear: when the short-term moving average (EMA_fast) crosses above the long-term moving average (EMA_slow) forming a golden cross, and the current ATR is higher than its mean plus one standard deviation, a long signal is generated; when the short-term moving average crosses below the long-term moving average forming a death cross, and the same ATR condition is met, a short signal is generated. Exit conditions are trend reversal (moving averages cross again) or a significant decrease in volatility (ATR below its mean minus one standard deviation).
To control risk, the strategy sets up dynamic stop-losses based on ATR (entry price ±2ATR) and take-profits (entry price ±4ATR), and implements dynamic position sizing based on account equity percentage and market volatility, ensuring that the risk of a single trade does not exceed 1%-2% of account equity.
Strategy Advantages
-
High Volatility Environment Capture: The strategy ensures trading only in high volatility environments through ATR filtering, enabling it to fully exploit price movements during market turbulence, enhancing profit potential.
-
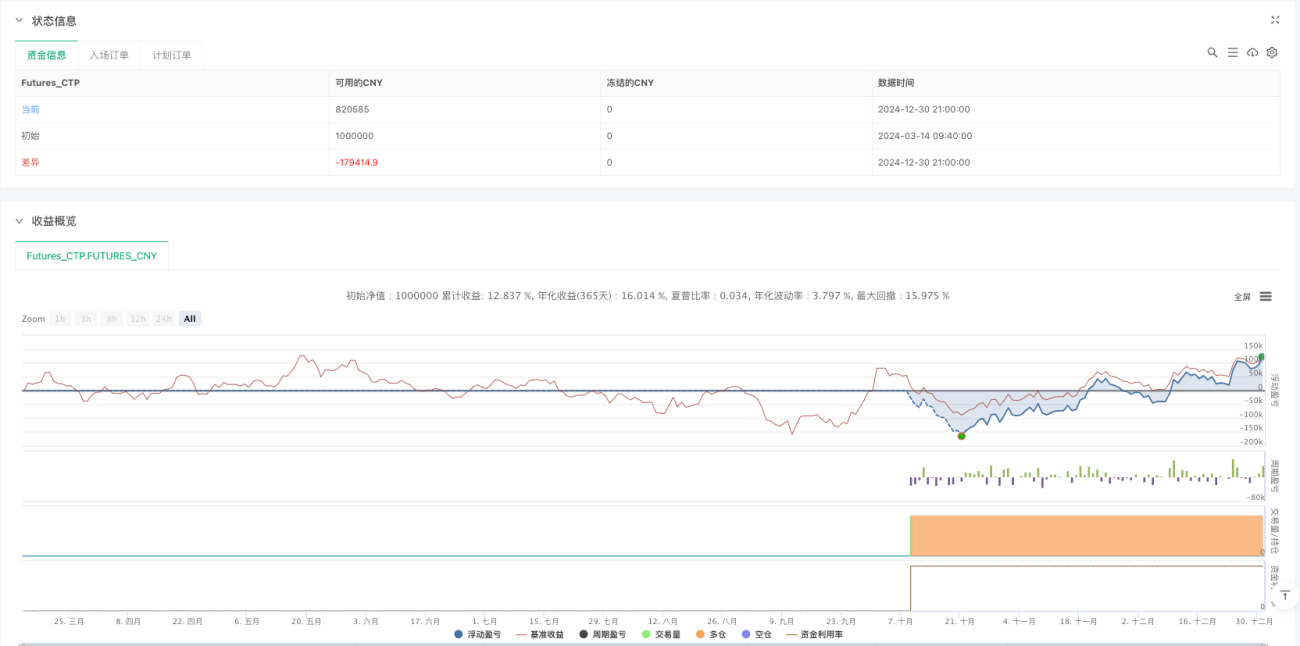
Risk-Adjusted Returns: By combining trend following and volatility filtering, it avoids ineffective trades during low volatility periods, significantly improving the ratio of returns to risk, i.e., the Sharpe Ratio.
-
Strong Adaptability: The dynamic stop-loss and position sizing mechanisms based on ATR can automatically adjust according to market conditions, allowing the strategy to maintain appropriate risk control in different volatility environments.
-
Large Parameter Optimization Space: Multiple key parameters of the strategy (such as EMA periods, ATR thresholds, risk factors) can be optimized according to specific market conditions, enhancing the system's adaptability.
-
Simple and Efficient Implementation: The design based on daily data makes the strategy relatively simple to implement, with low computational requirements, suitable for medium-frequency traders without the need for complex high-frequency data support.
Strategy Risks
-
False Breakout Risk: In oscillating markets, moving average crossovers may generate false signals, leading to frequent trading and losses. The solution could be to add additional confirmation indicators such as volume or RSI to filter out false signals.
-
Trading Cost Impact: Frequent trading in high volatility markets may lead to higher trading costs, including commissions and slippage. It is recommended to fully consider these costs in backtesting, and possibly reduce trading frequency by extending holding periods or raising entry thresholds.
-
Drawdown Risk: Although the strategy has stop-loss mechanisms, actual losses may exceed expectations under extreme market conditions (such as gaps or flash crashes). It is advisable to set total account risk limits to ensure the cumulative risk of all positions remains within an acceptable range.
-
Parameter Sensitivity: Strategy performance may be sensitive to parameter selection, and different market environments may require different parameter settings. The solution is to regularly re-optimize parameters or adopt adaptive parameter methods.
-
Market Environment Changes: In low volatility environments or markets without clear trends, the strategy may have no trading signals for extended periods or generate suboptimal signals. Consider switching to different strategies under different market environments.
Strategy Optimization Directions
-
Multi-level Volatility Filtering: Introduce volatility indicators from multiple timeframes, such as short-term, medium-term, and long-term ATR, ensuring that conditions for high volatility are met across different time scales before entry, reducing false signals.
-
Machine Learning Enhancement: Incorporate machine learning algorithms to predict trends and volatility, such as using LSTM or Random Forest models to predict future ATR levels and price trends, improving signal quality.
-
Adaptive Parameters: Implement adaptive adjustment of EMA periods and ATR thresholds, such as automatically adjusting parameters in different market cycles to adapt to changing market conditions, enhancing strategy robustness.
-
Sentiment Indicator Integration: Introduce market sentiment indicators such as VIX (Volatility Index), fund flows, or options market data to provide additional confirmation for entry signals, improving signal quality.
-
Stop-Loss and Take-Profit Optimization: Implement more sophisticated stop-loss and take-profit strategies, such as ATR-based trailing stops or intelligent take-profits based on support/resistance levels, improving the profit-to-loss ratio.
-
Multi-Market Adaptability: Extend the strategy to run simultaneously across multiple related markets, leveraging inter-market correlations and volatility differences to diversify risk and increase opportunities.
-
Market Environment Classification: Develop a market environment recognition module to adjust strategy parameters or trading logic under different market environments (trending, oscillating, high volatility, low volatility, etc.), enhancing the strategy's all-weather performance.
Summary
The Volatility-Filtered Dual EMA Crossover High Sharpe Ratio Strategy is a quantitative trading system that combines trend following and volatility filtering, pursuing risk-adjusted high returns by trading only in high volatility environments. The strategy determines trend direction through fast and slow moving average crossovers, while using ATR-related indicators to ensure the market is in a high volatility state, thereby improving the quality of trading signals.
Dynamic stop-loss, take-profit, and position sizing mechanisms enable the strategy to effectively control risk and adapt to different market conditions. Although risks such as false breakouts, trading costs, and parameter sensitivity exist, the robustness and performance of the strategy can be further enhanced through optimization directions such as multi-level volatility filtering, sentiment indicator integration, and machine learning enhancement.
For quantitative traders seeking higher risk-adjusted returns in high volatility markets, this is a strategy framework worth considering. Before actual deployment, it is recommended to conduct thorough historical backtesting and parameter optimization, and adjust strategy parameters according to specific market characteristics to achieve optimal trading results.